bacterium HR07
Taxonomy: cellular organisms; Bacteria; unclassified Bacteria
Average proteome isoelectric point is 6.92
Get precalculated fractions of proteins
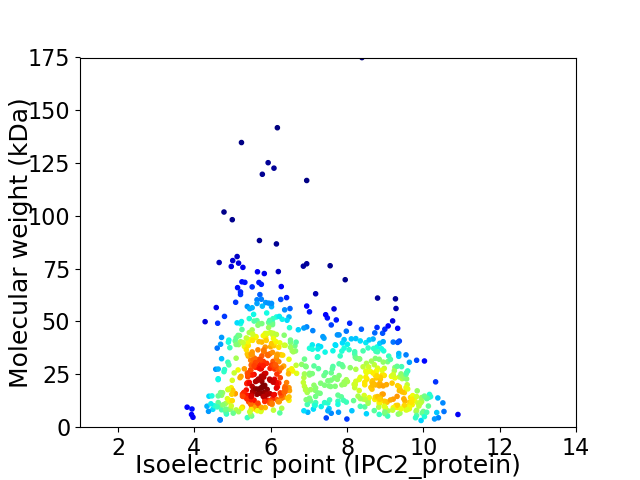
Virtual 2D-PAGE plot for 726 proteins (isoelectric point calculated using IPC2_protein)
Get csv file with sequences according to given criteria:
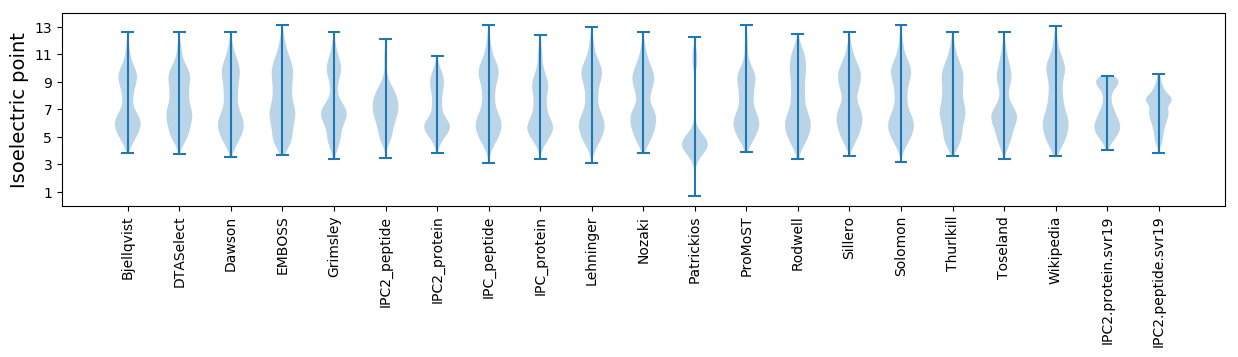
* You can choose from 21 different methods for calculating isoelectric point
Summary statistics related to proteome-wise predictions
Protein with the lowest isoelectric point:
>tr|A0A2H5VIG4|A0A2H5VIG4_9BACT 3-ketoacyl-CoA thiolase OS=bacterium HR07 OX=2035402 GN=fadA PE=3 SV=1
MM1 pKa = 7.83PEE3 pKa = 3.58VTIYY7 pKa = 7.52TTPTCSWCAAAKK19 pKa = 10.27RR20 pKa = 11.84FLDD23 pKa = 3.49EE24 pKa = 5.11HH25 pKa = 6.53EE26 pKa = 4.37IDD28 pKa = 3.58YY29 pKa = 10.56TEE31 pKa = 4.61YY32 pKa = 10.9DD33 pKa = 3.39VSEE36 pKa = 4.63DD37 pKa = 3.74PEE39 pKa = 4.25VLLRR43 pKa = 11.84LSGQTGVPVLDD54 pKa = 3.43IDD56 pKa = 4.11GEE58 pKa = 4.46IVVGFDD64 pKa = 2.9RR65 pKa = 11.84GRR67 pKa = 11.84IAEE70 pKa = 4.17LLGLEE75 pKa = 4.81DD76 pKa = 3.71EE77 pKa = 4.77
MM1 pKa = 7.83PEE3 pKa = 3.58VTIYY7 pKa = 7.52TTPTCSWCAAAKK19 pKa = 10.27RR20 pKa = 11.84FLDD23 pKa = 3.49EE24 pKa = 5.11HH25 pKa = 6.53EE26 pKa = 4.37IDD28 pKa = 3.58YY29 pKa = 10.56TEE31 pKa = 4.61YY32 pKa = 10.9DD33 pKa = 3.39VSEE36 pKa = 4.63DD37 pKa = 3.74PEE39 pKa = 4.25VLLRR43 pKa = 11.84LSGQTGVPVLDD54 pKa = 3.43IDD56 pKa = 4.11GEE58 pKa = 4.46IVVGFDD64 pKa = 2.9RR65 pKa = 11.84GRR67 pKa = 11.84IAEE70 pKa = 4.17LLGLEE75 pKa = 4.81DD76 pKa = 3.71EE77 pKa = 4.77
Molecular weight: 8.6 kDa
Isoelectric point according different methods:
Protein with the highest isoelectric point:
>tr|A0A2H5VHC6|A0A2H5VHC6_9BACT Protein TolB OS=bacterium HR07 OX=2035402 GN=tolB_1 PE=4 SV=1
MM1 pKa = 7.24SASPASPIRR10 pKa = 11.84KK11 pKa = 7.62TGQKK15 pKa = 9.86SAWFIVKK22 pKa = 10.29KK23 pKa = 10.94LMGSLKK29 pKa = 10.09TSIPNAKK36 pKa = 9.98VMITAMVPVRR46 pKa = 11.84VRR48 pKa = 11.84ATPRR52 pKa = 11.84PNRR55 pKa = 3.63
MM1 pKa = 7.24SASPASPIRR10 pKa = 11.84KK11 pKa = 7.62TGQKK15 pKa = 9.86SAWFIVKK22 pKa = 10.29KK23 pKa = 10.94LMGSLKK29 pKa = 10.09TSIPNAKK36 pKa = 9.98VMITAMVPVRR46 pKa = 11.84VRR48 pKa = 11.84ATPRR52 pKa = 11.84PNRR55 pKa = 3.63
Molecular weight: 6.01 kDa
Isoelectric point according different methods:
Peptides (in silico digests for buttom-up proteomics)
Below you can find in silico digests of the whole proteome with Trypsin, Chymotrypsin, Trypsin+LysC, LysN, ArgC proteases suitable for different mass spec machines.| Try ESI |
 |
|---|
| ChTry ESI |
|
|---|
| ArgC ESI |
|
|---|
| LysN ESI |
|
|---|
| TryLysC ESI |
|
|---|
| Try MALDI |
|
|---|
| ChTry MALDI |
|
|---|
| ArgC MALDI |
|
|---|
| LysN MALDI |
|
|---|
| TryLysC MALDI |
|
|---|
| Try LTQ |
|
|---|
| ChTry LTQ |
|
|---|
| ArgC LTQ |
|
|---|
| LysN LTQ |
|
|---|
| TryLysC LTQ |
|
|---|
| Try MSlow |
|
|---|
| ChTry MSlow |
|
|---|
| ArgC MSlow |
|
|---|
| LysN MSlow |
|
|---|
| TryLysC MSlow |
|
|---|
| Try MShigh |
|
|---|
| ChTry MShigh |
|
|---|
| ArgC MShigh |
|
|---|
| LysN MShigh |
|
|---|
| TryLysC MShigh |
|
|---|
General Statistics
Number of major isoforms |
Number of additional isoforms |
Number of all proteins |
Number of amino acids |
Min. Seq. Length |
Max. Seq. Length |
Avg. Seq. Length |
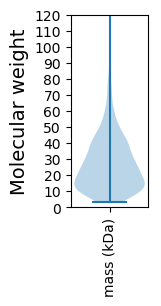
Avg. Mol. Weight |
|---|---|---|---|---|---|---|---|
0 |
183638 |
31 |
1558 |
252.9 |
28.14 |
Amino acid frequency
Ala |
Cys |
Asp |
Glu |
Phe |
Gly |
His |
Ile |
Lys |
Leu |
|---|---|---|---|---|---|---|---|---|---|
9.336 ± 0.117 | 0.992 ± 0.043 |
4.539 ± 0.07 | 7.18 ± 0.105 |
4.028 ± 0.07 | 7.68 ± 0.091 |
2.252 ± 0.056 | 6.097 ± 0.08 |
4.549 ± 0.079 | 11.171 ± 0.115 |
Met |
Asn |
Gln |
Pro |
Arg |
Ser |
Thr |
Val |
Trp |
Tyr |
|---|---|---|---|---|---|---|---|---|---|
1.904 ± 0.044 | 2.348 ± 0.051 |
5.155 ± 0.072 | 3.969 ± 0.079 |
7.048 ± 0.093 | 4.88 ± 0.068 |
5.086 ± 0.072 | 7.737 ± 0.083 |
1.307 ± 0.037 | 2.741 ± 0.056 |
Most of the basic statistics you can see at this page can be downloaded from this CSV file
See this proteome in:

Proteome-pI is available under Creative Commons Attribution-NoDerivs license, for more details see here
| Reference: Kozlowski LP. Proteome-pI 2.0: Proteome Isoelectric Point Database Update. Nucleic Acids Res. 2021, doi: 10.1093/nar/gkab944 | Contact: Lukasz P. Kozlowski |