Leptothrix mobilis
Taxonomy: cellular organisms; Bacteria; Proteobacteria; Betaproteobacteria; Burkholderiales; Burkholderiales genera incertae sedis; Leptothrix
Average proteome isoelectric point is 6.83
Get precalculated fractions of proteins
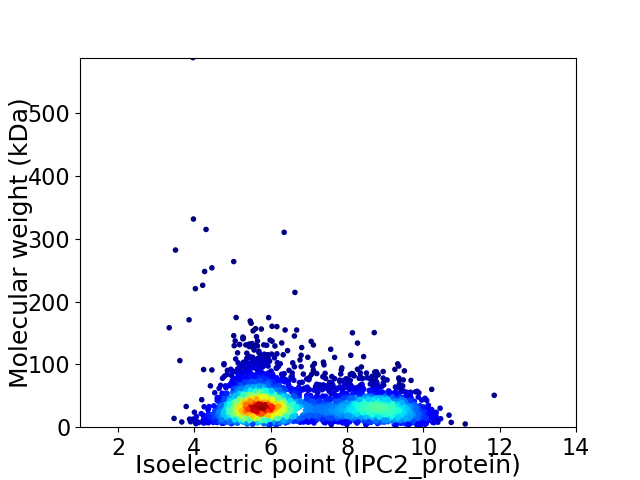
Virtual 2D-PAGE plot for 4025 proteins (isoelectric point calculated using IPC2_protein)
Get csv file with sequences according to given criteria:
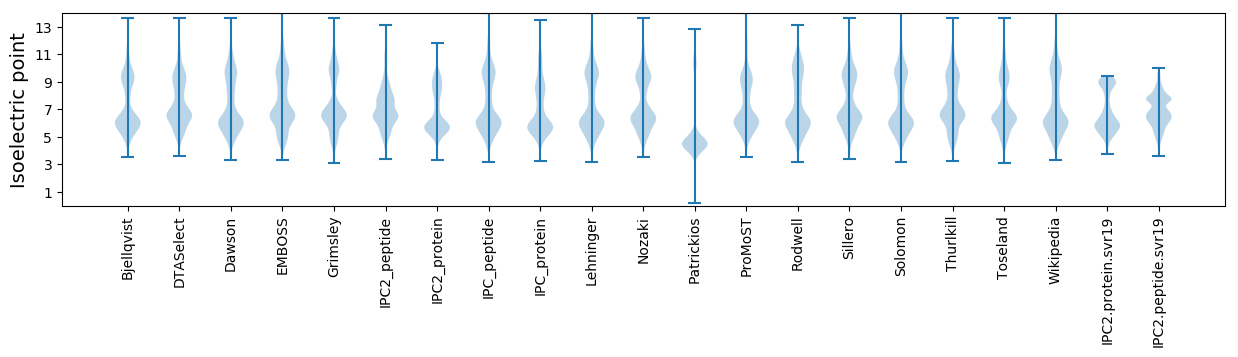
* You can choose from 21 different methods for calculating isoelectric point
Summary statistics related to proteome-wise predictions
Protein with the lowest isoelectric point:
>tr|A0A4Q7LHG7|A0A4Q7LHG7_9BURK Ubiquinone/menaquinone biosynthesis C-methyltransferase UbiE OS=Leptothrix mobilis OX=47994 GN=ubiE PE=3 SV=1
MM1 pKa = 6.82NTHH4 pKa = 7.22ILRR7 pKa = 11.84SCAAAALASACLLLSACGDD26 pKa = 3.59SSTLPDD32 pKa = 3.62VPVATAEE39 pKa = 4.08TSPAVAINLVQDD51 pKa = 3.78VAATSDD57 pKa = 3.55AQSDD61 pKa = 3.88SSEE64 pKa = 4.08PLAVPDD70 pKa = 4.08TLAVDD75 pKa = 4.35DD76 pKa = 4.51SGEE79 pKa = 3.89PRR81 pKa = 11.84AVNN84 pKa = 3.28
MM1 pKa = 6.82NTHH4 pKa = 7.22ILRR7 pKa = 11.84SCAAAALASACLLLSACGDD26 pKa = 3.59SSTLPDD32 pKa = 3.62VPVATAEE39 pKa = 4.08TSPAVAINLVQDD51 pKa = 3.78VAATSDD57 pKa = 3.55AQSDD61 pKa = 3.88SSEE64 pKa = 4.08PLAVPDD70 pKa = 4.08TLAVDD75 pKa = 4.35DD76 pKa = 4.51SGEE79 pKa = 3.89PRR81 pKa = 11.84AVNN84 pKa = 3.28
Molecular weight: 8.32 kDa
Isoelectric point according different methods:
Protein with the highest isoelectric point:
>tr|A0A4Q7LIA8|A0A4Q7LIA8_9BURK Anhydro-N-acetylmuramic acid kinase OS=Leptothrix mobilis OX=47994 GN=anmK PE=3 SV=1
MM1 pKa = 7.35KK2 pKa = 9.43RR3 pKa = 11.84TYY5 pKa = 10.25QPSKK9 pKa = 8.87VRR11 pKa = 11.84RR12 pKa = 11.84ARR14 pKa = 11.84THH16 pKa = 5.65GFLVRR21 pKa = 11.84MKK23 pKa = 9.35TAGGRR28 pKa = 11.84KK29 pKa = 8.95VIANRR34 pKa = 11.84RR35 pKa = 11.84SKK37 pKa = 10.36GRR39 pKa = 11.84KK40 pKa = 8.98RR41 pKa = 11.84LGLL44 pKa = 3.7
MM1 pKa = 7.35KK2 pKa = 9.43RR3 pKa = 11.84TYY5 pKa = 10.25QPSKK9 pKa = 8.87VRR11 pKa = 11.84RR12 pKa = 11.84ARR14 pKa = 11.84THH16 pKa = 5.65GFLVRR21 pKa = 11.84MKK23 pKa = 9.35TAGGRR28 pKa = 11.84KK29 pKa = 8.95VIANRR34 pKa = 11.84RR35 pKa = 11.84SKK37 pKa = 10.36GRR39 pKa = 11.84KK40 pKa = 8.98RR41 pKa = 11.84LGLL44 pKa = 3.7
Molecular weight: 5.12 kDa
Isoelectric point according different methods:
Peptides (in silico digests for buttom-up proteomics)
Below you can find in silico digests of the whole proteome with Trypsin, Chymotrypsin, Trypsin+LysC, LysN, ArgC proteases suitable for different mass spec machines.| Try ESI |
 |
|---|
| ChTry ESI |
|
|---|
| ArgC ESI |
|
|---|
| LysN ESI |
|
|---|
| TryLysC ESI |
|
|---|
| Try MALDI |
|
|---|
| ChTry MALDI |
|
|---|
| ArgC MALDI |
|
|---|
| LysN MALDI |
|
|---|
| TryLysC MALDI |
|
|---|
| Try LTQ |
|
|---|
| ChTry LTQ |
|
|---|
| ArgC LTQ |
|
|---|
| LysN LTQ |
|
|---|
| TryLysC LTQ |
|
|---|
| Try MSlow |
|
|---|
| ChTry MSlow |
|
|---|
| ArgC MSlow |
|
|---|
| LysN MSlow |
|
|---|
| TryLysC MSlow |
|
|---|
| Try MShigh |
|
|---|
| ChTry MShigh |
|
|---|
| ArgC MShigh |
|
|---|
| LysN MShigh |
|
|---|
| TryLysC MShigh |
|
|---|
General Statistics
Number of major isoforms |
Number of additional isoforms |
Number of all proteins |
Number of amino acids |
Min. Seq. Length |
Max. Seq. Length |
Avg. Seq. Length |
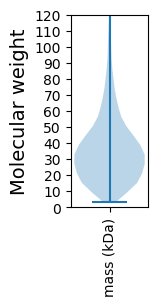
Avg. Mol. Weight |
|---|---|---|---|---|---|---|---|
0 |
1415505 |
30 |
5811 |
351.7 |
37.95 |
Amino acid frequency
Ala |
Cys |
Asp |
Glu |
Phe |
Gly |
His |
Ile |
Lys |
Leu |
|---|---|---|---|---|---|---|---|---|---|
13.555 ± 0.059 | 0.888 ± 0.014 |
5.729 ± 0.037 | 4.937 ± 0.031 |
2.968 ± 0.025 | 8.534 ± 0.039 |
2.436 ± 0.024 | 3.974 ± 0.028 |
2.509 ± 0.032 | 11.196 ± 0.052 |
Met |
Asn |
Gln |
Pro |
Arg |
Ser |
Thr |
Val |
Trp |
Tyr |
|---|---|---|---|---|---|---|---|---|---|
2.218 ± 0.019 | 2.262 ± 0.028 |
5.582 ± 0.036 | 3.947 ± 0.028 |
7.589 ± 0.053 | 5.21 ± 0.03 |
5.238 ± 0.048 | 7.753 ± 0.034 |
1.566 ± 0.019 | 1.909 ± 0.018 |
Most of the basic statistics you can see at this page can be downloaded from this CSV file
See this proteome in:

Proteome-pI is available under Creative Commons Attribution-NoDerivs license, for more details see here
| Reference: Kozlowski LP. Proteome-pI 2.0: Proteome Isoelectric Point Database Update. Nucleic Acids Res. 2021, doi: 10.1093/nar/gkab944 | Contact: Lukasz P. Kozlowski |