Ralstonia solanacearum (strain GMI1000) (Pseudomonas solanacearum)
Taxonomy: cellular organisms; Bacteria; Proteobacteria; Betaproteobacteria; Burkholderiales; Burkholderiaceae; Ralstonia; Ralstonia solanacearum
Average proteome isoelectric point is 6.97
Get precalculated fractions of proteins
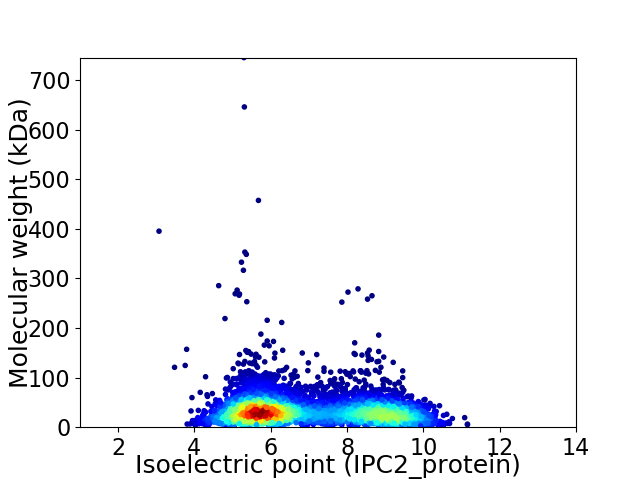
Virtual 2D-PAGE plot for 5002 proteins (isoelectric point calculated using IPC2_protein)
Get csv file with sequences according to given criteria:
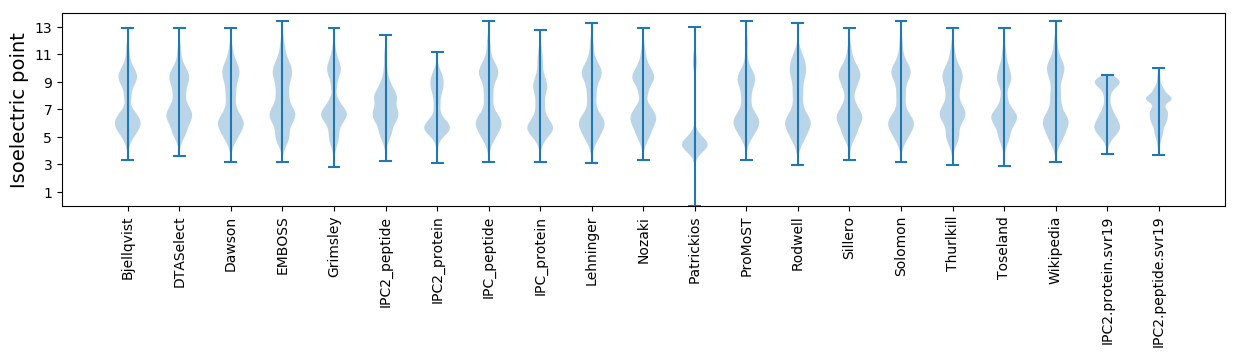
* You can choose from 21 different methods for calculating isoelectric point
Summary statistics related to proteome-wise predictions
Protein with the lowest isoelectric point:
>tr|Q8XSB9|Q8XSB9_RALSO Putative transmembrane protein OS=Ralstonia solanacearum (strain GMI1000) OX=267608 GN=RSp0559 PE=4 SV=1
MM1 pKa = 8.26DD2 pKa = 5.07IPTANYY8 pKa = 9.5NAFVTEE14 pKa = 4.48LTAITCKK21 pKa = 10.79YY22 pKa = 9.91GVALTAIGGVSIADD36 pKa = 3.49EE37 pKa = 4.51PGAFRR42 pKa = 11.84DD43 pKa = 3.66VAYY46 pKa = 10.8VADD49 pKa = 3.81ITSGDD54 pKa = 4.36LYY56 pKa = 11.44AKK58 pKa = 10.55DD59 pKa = 3.95PEE61 pKa = 4.47SS62 pKa = 3.32
MM1 pKa = 8.26DD2 pKa = 5.07IPTANYY8 pKa = 9.5NAFVTEE14 pKa = 4.48LTAITCKK21 pKa = 10.79YY22 pKa = 9.91GVALTAIGGVSIADD36 pKa = 3.49EE37 pKa = 4.51PGAFRR42 pKa = 11.84DD43 pKa = 3.66VAYY46 pKa = 10.8VADD49 pKa = 3.81ITSGDD54 pKa = 4.36LYY56 pKa = 11.44AKK58 pKa = 10.55DD59 pKa = 3.95PEE61 pKa = 4.47SS62 pKa = 3.32
Molecular weight: 6.47 kDa
Isoelectric point according different methods:
Protein with the highest isoelectric point:
>tr|Q8XZC0|Q8XZC0_RALSO Probable transmembrane protein OS=Ralstonia solanacearum (strain GMI1000) OX=267608 GN=RSc1481 PE=4 SV=1
MM1 pKa = 8.7VLMLPQARR9 pKa = 11.84SGAQVRR15 pKa = 11.84AVRR18 pKa = 11.84VSAMSRR24 pKa = 11.84PVASAVRR31 pKa = 11.84VPVAKK36 pKa = 10.58VAGKK40 pKa = 8.97PVARR44 pKa = 11.84AKK46 pKa = 10.22PVASASAKK54 pKa = 8.93RR55 pKa = 11.84RR56 pKa = 11.84KK57 pKa = 9.41RR58 pKa = 3.4
MM1 pKa = 8.7VLMLPQARR9 pKa = 11.84SGAQVRR15 pKa = 11.84AVRR18 pKa = 11.84VSAMSRR24 pKa = 11.84PVASAVRR31 pKa = 11.84VPVAKK36 pKa = 10.58VAGKK40 pKa = 8.97PVARR44 pKa = 11.84AKK46 pKa = 10.22PVASASAKK54 pKa = 8.93RR55 pKa = 11.84RR56 pKa = 11.84KK57 pKa = 9.41RR58 pKa = 3.4
Molecular weight: 6.08 kDa
Isoelectric point according different methods:
Peptides (in silico digests for buttom-up proteomics)
Below you can find in silico digests of the whole proteome with Trypsin, Chymotrypsin, Trypsin+LysC, LysN, ArgC proteases suitable for different mass spec machines.| Try ESI |
 |
|---|
| ChTry ESI |
|
|---|
| ArgC ESI |
|
|---|
| LysN ESI |
|
|---|
| TryLysC ESI |
|
|---|
| Try MALDI |
|
|---|
| ChTry MALDI |
|
|---|
| ArgC MALDI |
|
|---|
| LysN MALDI |
|
|---|
| TryLysC MALDI |
|
|---|
| Try LTQ |
|
|---|
| ChTry LTQ |
|
|---|
| ArgC LTQ |
|
|---|
| LysN LTQ |
|
|---|
| TryLysC LTQ |
|
|---|
| Try MSlow |
|
|---|
| ChTry MSlow |
|
|---|
| ArgC MSlow |
|
|---|
| LysN MSlow |
|
|---|
| TryLysC MSlow |
|
|---|
| Try MShigh |
|
|---|
| ChTry MShigh |
|
|---|
| ArgC MShigh |
|
|---|
| LysN MShigh |
|
|---|
| TryLysC MShigh |
|
|---|
General Statistics
Number of major isoforms |
Number of additional isoforms |
Number of all proteins |
Number of amino acids |
Min. Seq. Length |
Max. Seq. Length |
Avg. Seq. Length |
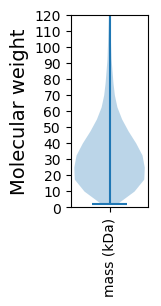
Avg. Mol. Weight |
|---|---|---|---|---|---|---|---|
0 |
1662664 |
20 |
6889 |
332.4 |
35.96 |
Amino acid frequency
Ala |
Cys |
Asp |
Glu |
Phe |
Gly |
His |
Ile |
Lys |
Leu |
|---|---|---|---|---|---|---|---|---|---|
13.414 ± 0.055 | 0.936 ± 0.013 |
5.403 ± 0.029 | 4.898 ± 0.037 |
3.368 ± 0.026 | 8.406 ± 0.051 |
2.323 ± 0.024 | 4.357 ± 0.025 |
2.843 ± 0.033 | 10.305 ± 0.052 |
Met |
Asn |
Gln |
Pro |
Arg |
Ser |
Thr |
Val |
Trp |
Tyr |
|---|---|---|---|---|---|---|---|---|---|
2.332 ± 0.019 | 2.689 ± 0.041 |
5.392 ± 0.034 | 3.896 ± 0.023 |
7.284 ± 0.051 | 5.318 ± 0.042 |
5.564 ± 0.059 | 7.499 ± 0.032 |
1.413 ± 0.015 | 2.361 ± 0.021 |
Most of the basic statistics you can see at this page can be downloaded from this CSV file
See this proteome in:

Proteome-pI is available under Creative Commons Attribution-NoDerivs license, for more details see here
| Reference: Kozlowski LP. Proteome-pI 2.0: Proteome Isoelectric Point Database Update. Nucleic Acids Res. 2021, doi: 10.1093/nar/gkab944 | Contact: Lukasz P. Kozlowski |