Caballeronia grimmiae
Taxonomy: cellular organisms; Bacteria; Proteobacteria; Betaproteobacteria; Burkholderiales; Burkholderiaceae; Caballeronia
Average proteome isoelectric point is 6.74
Get precalculated fractions of proteins
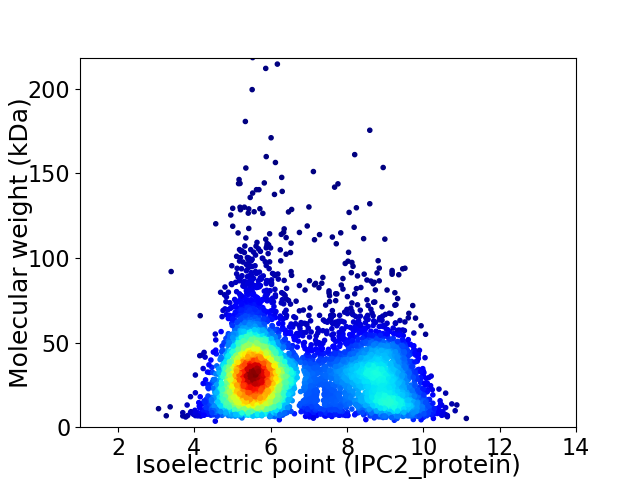
Virtual 2D-PAGE plot for 5937 proteins (isoelectric point calculated using IPC2_protein)
Get csv file with sequences according to given criteria:
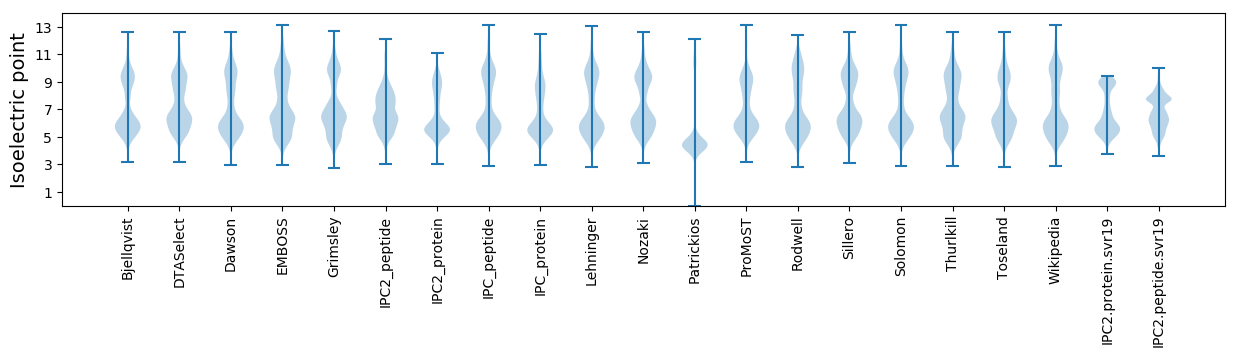
* You can choose from 21 different methods for calculating isoelectric point
Summary statistics related to proteome-wise predictions
Protein with the lowest isoelectric point:
>tr|A0A069PCD8|A0A069PCD8_9BURK Non-specific serine/threonine protein kinase OS=Caballeronia grimmiae OX=1071679 GN=BG57_03170 PE=4 SV=1
MM1 pKa = 7.36SVLSVTDD8 pKa = 4.25LEE10 pKa = 4.86CSRR13 pKa = 11.84EE14 pKa = 3.93LDD16 pKa = 3.79DD17 pKa = 5.27AAMSAISGGGGALWIFGWITPYY39 pKa = 10.41ISGRR43 pKa = 11.84QEE45 pKa = 3.81GFGGVVNIYY54 pKa = 10.52DD55 pKa = 3.34ITNNFTADD63 pKa = 3.18QMINQFQSVNVHH75 pKa = 5.71NSGNGANLNVSPNAASANSAGG96 pKa = 3.64
MM1 pKa = 7.36SVLSVTDD8 pKa = 4.25LEE10 pKa = 4.86CSRR13 pKa = 11.84EE14 pKa = 3.93LDD16 pKa = 3.79DD17 pKa = 5.27AAMSAISGGGGALWIFGWITPYY39 pKa = 10.41ISGRR43 pKa = 11.84QEE45 pKa = 3.81GFGGVVNIYY54 pKa = 10.52DD55 pKa = 3.34ITNNFTADD63 pKa = 3.18QMINQFQSVNVHH75 pKa = 5.71NSGNGANLNVSPNAASANSAGG96 pKa = 3.64
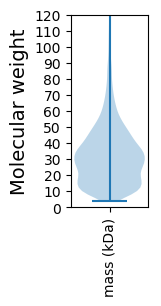
Molecular weight: 9.99 kDa
Isoelectric point according different methods:
Protein with the highest isoelectric point:
>tr|A0A069P589|A0A069P589_9BURK Chemotaxis protein CheW OS=Caballeronia grimmiae OX=1071679 GN=BG57_28285 PE=4 SV=1
MM1 pKa = 7.35KK2 pKa = 9.36RR3 pKa = 11.84TYY5 pKa = 10.06QPSVTRR11 pKa = 11.84RR12 pKa = 11.84KK13 pKa = 8.0RR14 pKa = 11.84THH16 pKa = 5.76GFRR19 pKa = 11.84VRR21 pKa = 11.84MKK23 pKa = 8.74TAGGRR28 pKa = 11.84KK29 pKa = 9.04VINARR34 pKa = 11.84RR35 pKa = 11.84AKK37 pKa = 9.58GRR39 pKa = 11.84KK40 pKa = 8.75RR41 pKa = 11.84LAVV44 pKa = 3.41
MM1 pKa = 7.35KK2 pKa = 9.36RR3 pKa = 11.84TYY5 pKa = 10.06QPSVTRR11 pKa = 11.84RR12 pKa = 11.84KK13 pKa = 8.0RR14 pKa = 11.84THH16 pKa = 5.76GFRR19 pKa = 11.84VRR21 pKa = 11.84MKK23 pKa = 8.74TAGGRR28 pKa = 11.84KK29 pKa = 9.04VINARR34 pKa = 11.84RR35 pKa = 11.84AKK37 pKa = 9.58GRR39 pKa = 11.84KK40 pKa = 8.75RR41 pKa = 11.84LAVV44 pKa = 3.41
Molecular weight: 5.18 kDa
Isoelectric point according different methods:
Peptides (in silico digests for buttom-up proteomics)
Below you can find in silico digests of the whole proteome with Trypsin, Chymotrypsin, Trypsin+LysC, LysN, ArgC proteases suitable for different mass spec machines.| Try ESI |
 |
|---|
| ChTry ESI |
|
|---|
| ArgC ESI |
|
|---|
| LysN ESI |
|
|---|
| TryLysC ESI |
|
|---|
| Try MALDI |
|
|---|
| ChTry MALDI |
|
|---|
| ArgC MALDI |
|
|---|
| LysN MALDI |
|
|---|
| TryLysC MALDI |
|
|---|
| Try LTQ |
|
|---|
| ChTry LTQ |
|
|---|
| ArgC LTQ |
|
|---|
| LysN LTQ |
|
|---|
| TryLysC LTQ |
|
|---|
| Try MSlow |
|
|---|
| ChTry MSlow |
|
|---|
| ArgC MSlow |
|
|---|
| LysN MSlow |
|
|---|
| TryLysC MSlow |
|
|---|
| Try MShigh |
|
|---|
| ChTry MShigh |
|
|---|
| ArgC MShigh |
|
|---|
| LysN MShigh |
|
|---|
| TryLysC MShigh |
|
|---|
General Statistics
Number of major isoforms |
Number of additional isoforms |
Number of all proteins |
Number of amino acids |
Min. Seq. Length |
Max. Seq. Length |
Avg. Seq. Length |
Avg. Mol. Weight |
|---|---|---|---|---|---|---|---|
0 |
1846429 |
31 |
2007 |
311.0 |
33.8 |
Amino acid frequency
Ala |
Cys |
Asp |
Glu |
Phe |
Gly |
His |
Ile |
Lys |
Leu |
|---|---|---|---|---|---|---|---|---|---|
12.777 ± 0.046 | 0.92 ± 0.011 |
5.629 ± 0.028 | 5.244 ± 0.032 |
3.744 ± 0.021 | 8.03 ± 0.035 |
2.305 ± 0.016 | 4.872 ± 0.022 |
3.269 ± 0.026 | 9.971 ± 0.036 |
Met |
Asn |
Gln |
Pro |
Arg |
Ser |
Thr |
Val |
Trp |
Tyr |
|---|---|---|---|---|---|---|---|---|---|
2.46 ± 0.015 | 2.795 ± 0.019 |
4.947 ± 0.02 | 3.44 ± 0.021 |
7.061 ± 0.032 | 5.741 ± 0.026 |
5.328 ± 0.021 | 7.737 ± 0.025 |
1.332 ± 0.012 | 2.398 ± 0.014 |
Most of the basic statistics you can see at this page can be downloaded from this CSV file
See this proteome in:

Proteome-pI is available under Creative Commons Attribution-NoDerivs license, for more details see here
| Reference: Kozlowski LP. Proteome-pI 2.0: Proteome Isoelectric Point Database Update. Nucleic Acids Res. 2021, doi: 10.1093/nar/gkab944 | Contact: Lukasz P. Kozlowski |