Salmonella virus BTP1
Taxonomy: Viruses; Duplodnaviria; Heunggongvirae; Uroviricota; Caudoviricetes; Caudovirales; Podoviridae; Lederbergvirus
Average proteome isoelectric point is 6.88
Get precalculated fractions of proteins
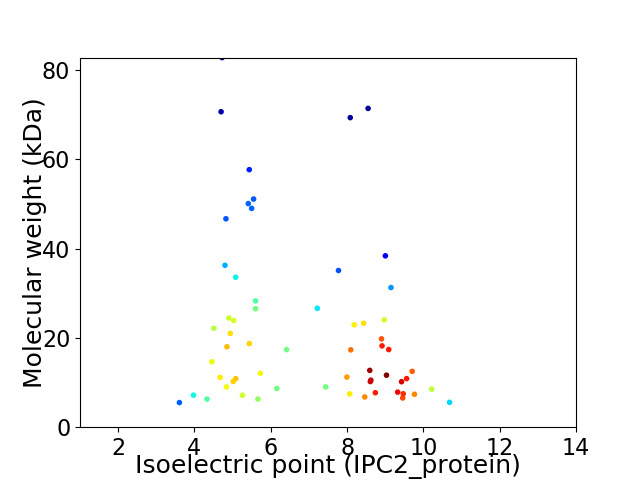
Virtual 2D-PAGE plot for 61 proteins (isoelectric point calculated using IPC2_protein)
Get csv file with sequences according to given criteria:
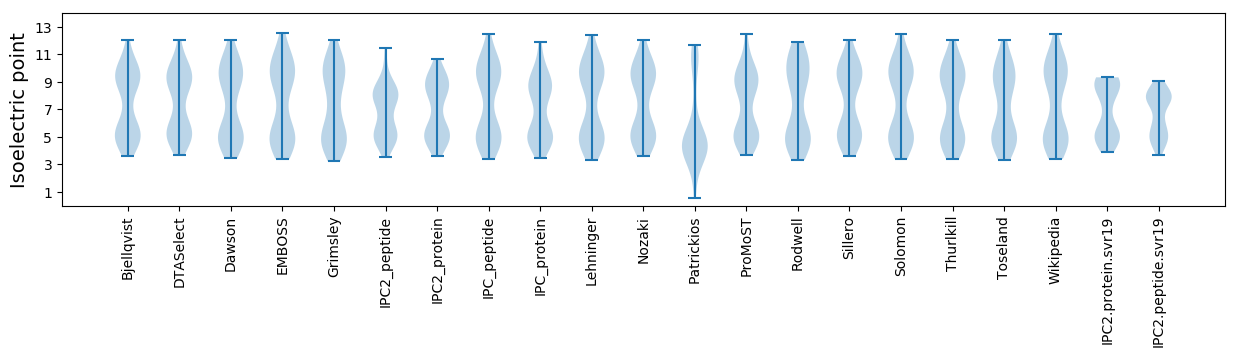
* You can choose from 21 different methods for calculating isoelectric point
Summary statistics related to proteome-wise predictions
Protein with the lowest isoelectric point:
>tr|A0A1R3Y5R6|A0A1R3Y5R6_9CAUD Capsid scaffolding protein OS=Salmonella virus BTP1 OX=1934252 GN=BTP1_004 PE=4 SV=1
MM1 pKa = 7.29LHH3 pKa = 7.3DD4 pKa = 4.58FDD6 pKa = 7.13DD7 pKa = 5.13DD8 pKa = 3.82EE9 pKa = 5.6FIALISPEE17 pKa = 3.74IEE19 pKa = 3.94EE20 pKa = 4.61EE21 pKa = 4.24VEE23 pKa = 4.03QQINLAAEE31 pKa = 4.07RR32 pKa = 11.84QNPVISWDD40 pKa = 3.48EE41 pKa = 3.67FAGYY45 pKa = 10.62YY46 pKa = 9.62SS47 pKa = 3.45
MM1 pKa = 7.29LHH3 pKa = 7.3DD4 pKa = 4.58FDD6 pKa = 7.13DD7 pKa = 5.13DD8 pKa = 3.82EE9 pKa = 5.6FIALISPEE17 pKa = 3.74IEE19 pKa = 3.94EE20 pKa = 4.61EE21 pKa = 4.24VEE23 pKa = 4.03QQINLAAEE31 pKa = 4.07RR32 pKa = 11.84QNPVISWDD40 pKa = 3.48EE41 pKa = 3.67FAGYY45 pKa = 10.62YY46 pKa = 9.62SS47 pKa = 3.45
Molecular weight: 5.52 kDa
Isoelectric point according different methods:
Protein with the highest isoelectric point:
>tr|A0A1R3Y5T6|A0A1R3Y5T6_9CAUD Transcriptional activator OS=Salmonella virus BTP1 OX=1934252 GN=c2 PE=4 SV=1
MM1 pKa = 7.39ARR3 pKa = 11.84QRR5 pKa = 11.84RR6 pKa = 11.84SITDD10 pKa = 4.1IICEE14 pKa = 3.96NCKK17 pKa = 10.21YY18 pKa = 10.77LPTKK22 pKa = 10.48RR23 pKa = 11.84SRR25 pKa = 11.84NKK27 pKa = 9.55PKK29 pKa = 10.29PIPKK33 pKa = 9.96EE34 pKa = 3.93SDD36 pKa = 3.19VKK38 pKa = 9.6TFNYY42 pKa = 7.51TAHH45 pKa = 6.73LWDD48 pKa = 3.61IRR50 pKa = 11.84WLRR53 pKa = 11.84EE54 pKa = 3.55RR55 pKa = 11.84ARR57 pKa = 11.84KK58 pKa = 7.22TRR60 pKa = 3.32
MM1 pKa = 7.39ARR3 pKa = 11.84QRR5 pKa = 11.84RR6 pKa = 11.84SITDD10 pKa = 4.1IICEE14 pKa = 3.96NCKK17 pKa = 10.21YY18 pKa = 10.77LPTKK22 pKa = 10.48RR23 pKa = 11.84SRR25 pKa = 11.84NKK27 pKa = 9.55PKK29 pKa = 10.29PIPKK33 pKa = 9.96EE34 pKa = 3.93SDD36 pKa = 3.19VKK38 pKa = 9.6TFNYY42 pKa = 7.51TAHH45 pKa = 6.73LWDD48 pKa = 3.61IRR50 pKa = 11.84WLRR53 pKa = 11.84EE54 pKa = 3.55RR55 pKa = 11.84ARR57 pKa = 11.84KK58 pKa = 7.22TRR60 pKa = 3.32
Molecular weight: 7.37 kDa
Isoelectric point according different methods:
Peptides (in silico digests for buttom-up proteomics)
Below you can find in silico digests of the whole proteome with Trypsin, Chymotrypsin, Trypsin+LysC, LysN, ArgC proteases suitable for different mass spec machines.| Try ESI |
 |
|---|
| ChTry ESI |
|
|---|
| ArgC ESI |
|
|---|
| LysN ESI |
|
|---|
| TryLysC ESI |
|
|---|
| Try MALDI |
|
|---|
| ChTry MALDI |
|
|---|
| ArgC MALDI |
|
|---|
| LysN MALDI |
|
|---|
| TryLysC MALDI |
|
|---|
| Try LTQ |
|
|---|
| ChTry LTQ |
|
|---|
| ArgC LTQ |
|
|---|
| LysN LTQ |
|
|---|
| TryLysC LTQ |
|
|---|
| Try MSlow |
|
|---|
| ChTry MSlow |
|
|---|
| ArgC MSlow |
|
|---|
| LysN MSlow |
|
|---|
| TryLysC MSlow |
|
|---|
| Try MShigh |
|
|---|
| ChTry MShigh |
|
|---|
| ArgC MShigh |
|
|---|
| LysN MShigh |
|
|---|
| TryLysC MShigh |
|
|---|
General Statistics
Number of major isoforms |
Number of additional isoforms |
Number of all proteins |
Number of amino acids |
Min. Seq. Length |
Max. Seq. Length |
Avg. Seq. Length |
Avg. Mol. Weight |
|---|---|---|---|---|---|---|---|
0 |
12236 |
47 |
725 |
200.6 |
22.4 |
Amino acid frequency
Ala |
Cys |
Asp |
Glu |
Phe |
Gly |
His |
Ile |
Lys |
Leu |
|---|---|---|---|---|---|---|---|---|---|
9.276 ± 0.528 | 1.226 ± 0.154 |
6.056 ± 0.263 | 6.309 ± 0.378 |
3.228 ± 0.212 | 7.159 ± 0.401 |
1.757 ± 0.201 | 6.415 ± 0.312 |
6.154 ± 0.331 | 7.511 ± 0.284 |
Met |
Asn |
Gln |
Pro |
Arg |
Ser |
Thr |
Val |
Trp |
Tyr |
|---|---|---|---|---|---|---|---|---|---|
2.803 ± 0.195 | 4.642 ± 0.233 |
3.972 ± 0.211 | 4.732 ± 0.499 |
5.901 ± 0.348 | 6.44 ± 0.388 |
5.239 ± 0.293 | 6.097 ± 0.269 |
1.667 ± 0.188 | 3.416 ± 0.226 |
Most of the basic statistics you can see at this page can be downloaded from this CSV file
See this proteome in:

Proteome-pI is available under Creative Commons Attribution-NoDerivs license, for more details see here
| Reference: Kozlowski LP. Proteome-pI 2.0: Proteome Isoelectric Point Database Update. Nucleic Acids Res. 2021, doi: 10.1093/nar/gkab944 | Contact: Lukasz P. Kozlowski |