Ligustrum virus A
Taxonomy: Viruses; Riboviria; Orthornavirae; Kitrinoviricota; Alsuviricetes; Tymovirales; Betaflexiviridae; Quinvirinae; Carlavirus
Average proteome isoelectric point is 6.84
Get precalculated fractions of proteins
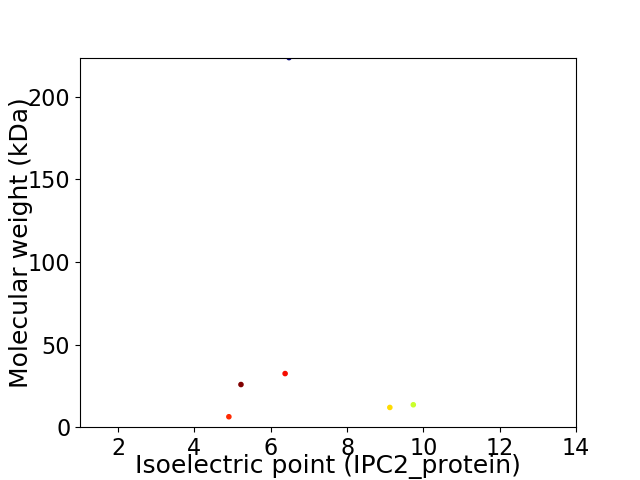
Virtual 2D-PAGE plot for 6 proteins (isoelectric point calculated using IPC2_protein)
Get csv file with sequences according to given criteria:
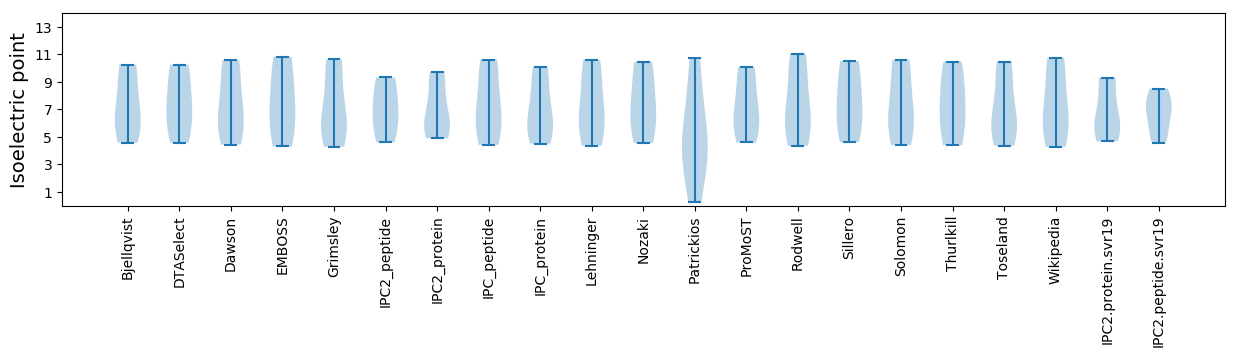
* You can choose from 21 different methods for calculating isoelectric point
Summary statistics related to proteome-wise predictions
Protein with the lowest isoelectric point:
>tr|A0A1C9IAX3|A0A1C9IAX3_9VIRU 7 kDa protein OS=Ligustrum virus A OX=1899566 PE=3 SV=1
MM1 pKa = 8.16IEE3 pKa = 3.83VCLVIACVLLIVASVYY19 pKa = 10.76LNSVNEE25 pKa = 4.34TCSITITGEE34 pKa = 3.72SVRR37 pKa = 11.84IIGCVQSPEE46 pKa = 3.94FLDD49 pKa = 5.61LIGKK53 pKa = 7.7LKK55 pKa = 10.34PAGSCC60 pKa = 3.6
MM1 pKa = 8.16IEE3 pKa = 3.83VCLVIACVLLIVASVYY19 pKa = 10.76LNSVNEE25 pKa = 4.34TCSITITGEE34 pKa = 3.72SVRR37 pKa = 11.84IIGCVQSPEE46 pKa = 3.94FLDD49 pKa = 5.61LIGKK53 pKa = 7.7LKK55 pKa = 10.34PAGSCC60 pKa = 3.6
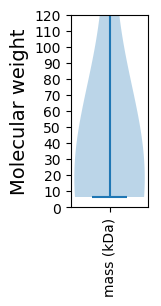
Molecular weight: 6.33 kDa
Isoelectric point according different methods:
Protein with the highest isoelectric point:
>tr|A0A1C9IAX3|A0A1C9IAX3_9VIRU 7 kDa protein OS=Ligustrum virus A OX=1899566 PE=3 SV=1
MM1 pKa = 7.54NSHH4 pKa = 6.66KK5 pKa = 10.46KK6 pKa = 10.66DD7 pKa = 3.25IVFLLLSVFKK17 pKa = 10.79KK18 pKa = 10.55RR19 pKa = 11.84GGSFPLAICVLIYY32 pKa = 10.43QLAFNKK38 pKa = 9.78QVGGGTSTYY47 pKa = 10.22ARR49 pKa = 11.84RR50 pKa = 11.84RR51 pKa = 11.84RR52 pKa = 11.84AVSIGRR58 pKa = 11.84CHH60 pKa = 6.1RR61 pKa = 11.84CYY63 pKa = 10.0RR64 pKa = 11.84VYY66 pKa = 10.42PPPYY70 pKa = 10.22FGTKK74 pKa = 9.72CDD76 pKa = 4.2NKK78 pKa = 9.53TCAPGLSYY86 pKa = 10.74NVKK89 pKa = 9.81VEE91 pKa = 3.76NFIRR95 pKa = 11.84WGVTEE100 pKa = 5.1VIPQRR105 pKa = 11.84AKK107 pKa = 10.76NKK109 pKa = 7.51TSEE112 pKa = 4.15VFRR115 pKa = 11.84IKK117 pKa = 10.72PNN119 pKa = 3.29
MM1 pKa = 7.54NSHH4 pKa = 6.66KK5 pKa = 10.46KK6 pKa = 10.66DD7 pKa = 3.25IVFLLLSVFKK17 pKa = 10.79KK18 pKa = 10.55RR19 pKa = 11.84GGSFPLAICVLIYY32 pKa = 10.43QLAFNKK38 pKa = 9.78QVGGGTSTYY47 pKa = 10.22ARR49 pKa = 11.84RR50 pKa = 11.84RR51 pKa = 11.84RR52 pKa = 11.84AVSIGRR58 pKa = 11.84CHH60 pKa = 6.1RR61 pKa = 11.84CYY63 pKa = 10.0RR64 pKa = 11.84VYY66 pKa = 10.42PPPYY70 pKa = 10.22FGTKK74 pKa = 9.72CDD76 pKa = 4.2NKK78 pKa = 9.53TCAPGLSYY86 pKa = 10.74NVKK89 pKa = 9.81VEE91 pKa = 3.76NFIRR95 pKa = 11.84WGVTEE100 pKa = 5.1VIPQRR105 pKa = 11.84AKK107 pKa = 10.76NKK109 pKa = 7.51TSEE112 pKa = 4.15VFRR115 pKa = 11.84IKK117 pKa = 10.72PNN119 pKa = 3.29
Molecular weight: 13.57 kDa
Isoelectric point according different methods:
Peptides (in silico digests for buttom-up proteomics)
Below you can find in silico digests of the whole proteome with Trypsin, Chymotrypsin, Trypsin+LysC, LysN, ArgC proteases suitable for different mass spec machines.| Try ESI |
 |
|---|
| ChTry ESI |
|
|---|
| ArgC ESI |
|
|---|
| LysN ESI |
|
|---|
| TryLysC ESI |
|
|---|
| Try MALDI |
|
|---|
| ChTry MALDI |
|
|---|
| ArgC MALDI |
|
|---|
| LysN MALDI |
|
|---|
| TryLysC MALDI |
|
|---|
| Try LTQ |
|
|---|
| ChTry LTQ |
|
|---|
| ArgC LTQ |
|
|---|
| LysN LTQ |
|
|---|
| TryLysC LTQ |
|
|---|
| Try MSlow |
|
|---|
| ChTry MSlow |
|
|---|
| ArgC MSlow |
|
|---|
| LysN MSlow |
|
|---|
| TryLysC MSlow |
|
|---|
| Try MShigh |
|
|---|
| ChTry MShigh |
|
|---|
| ArgC MShigh |
|
|---|
| LysN MShigh |
|
|---|
| TryLysC MShigh |
|
|---|
General Statistics
Number of major isoforms |
Number of additional isoforms |
Number of all proteins |
Number of amino acids |
Min. Seq. Length |
Max. Seq. Length |
Avg. Seq. Length |
Avg. Mol. Weight |
|---|---|---|---|---|---|---|---|
0 |
2777 |
60 |
1968 |
462.8 |
52.29 |
Amino acid frequency
Ala |
Cys |
Asp |
Glu |
Phe |
Gly |
His |
Ile |
Lys |
Leu |
|---|---|---|---|---|---|---|---|---|---|
6.734 ± 0.65 | 2.773 ± 0.325 |
4.861 ± 0.76 | 6.554 ± 0.968 |
5.51 ± 0.51 | 5.834 ± 0.276 |
2.125 ± 0.31 | 5.762 ± 1.034 |
6.338 ± 0.878 | 9.795 ± 1.013 |
Met |
Asn |
Gln |
Pro |
Arg |
Ser |
Thr |
Val |
Trp |
Tyr |
|---|---|---|---|---|---|---|---|---|---|
1.909 ± 0.391 | 4.429 ± 0.992 |
4.501 ± 1.256 | 3.709 ± 0.253 |
5.474 ± 0.458 | 7.166 ± 0.393 |
5.329 ± 0.301 | 6.59 ± 0.739 |
1.044 ± 0.158 | 3.565 ± 0.214 |
Most of the basic statistics you can see at this page can be downloaded from this CSV file
See this proteome in:

Proteome-pI is available under Creative Commons Attribution-NoDerivs license, for more details see here
| Reference: Kozlowski LP. Proteome-pI 2.0: Proteome Isoelectric Point Database Update. Nucleic Acids Res. 2021, doi: 10.1093/nar/gkab944 | Contact: Lukasz P. Kozlowski |