Vibrio phage helene 12B3
Taxonomy: Viruses; Duplodnaviria; Heunggongvirae; Uroviricota; Caudoviricetes; Caudovirales; Myoviridae; unclassified Myoviridae
Average proteome isoelectric point is 5.93
Get precalculated fractions of proteins
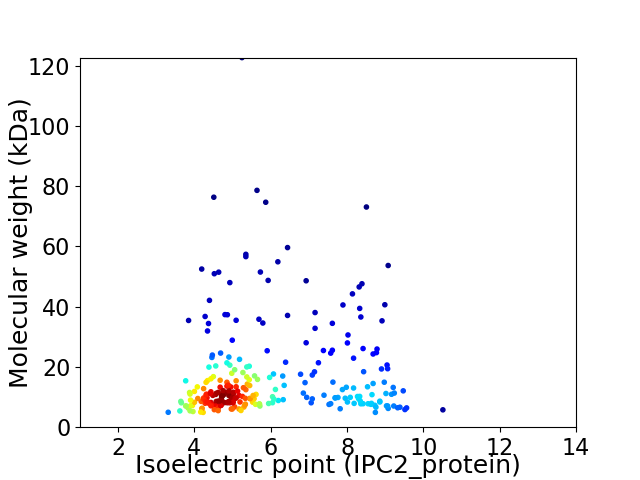
Virtual 2D-PAGE plot for 263 proteins (isoelectric point calculated using IPC2_protein)
Get csv file with sequences according to given criteria:
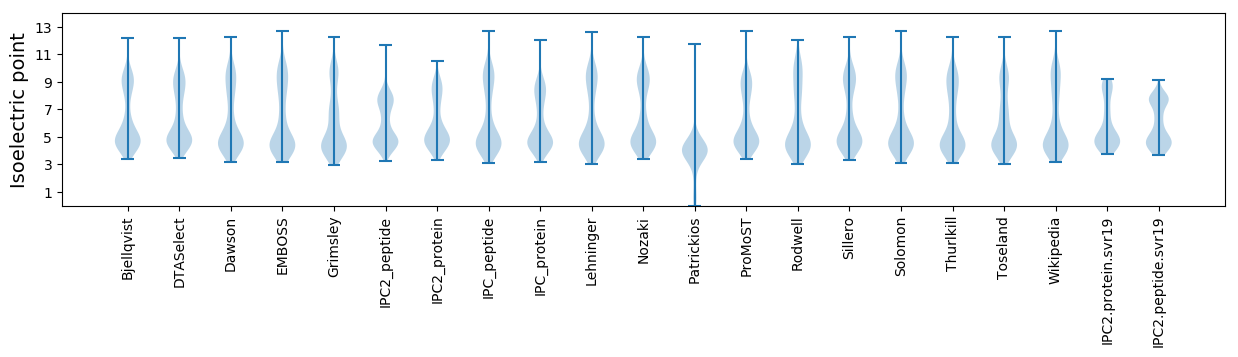
* You can choose from 21 different methods for calculating isoelectric point
Summary statistics related to proteome-wise predictions
Protein with the lowest isoelectric point:
>tr|M4M930|M4M930_9CAUD Uncharacterized protein OS=Vibrio phage helene 12B3 OX=573173 GN=VPBG_00080 PE=4 SV=1
MM1 pKa = 7.6TSTEE5 pKa = 3.98PLIGKK10 pKa = 6.93TFVCTDD16 pKa = 3.98PDD18 pKa = 3.83FKK20 pKa = 11.5GCVGTVEE27 pKa = 5.67DD28 pKa = 4.14IWFEE32 pKa = 4.14DD33 pKa = 4.45GIPYY37 pKa = 10.27EE38 pKa = 4.5FIRR41 pKa = 11.84VVGEE45 pKa = 4.13DD46 pKa = 3.52FSGTFLFNEE55 pKa = 5.65GYY57 pKa = 9.65IQNDD61 pKa = 3.67YY62 pKa = 11.42
MM1 pKa = 7.6TSTEE5 pKa = 3.98PLIGKK10 pKa = 6.93TFVCTDD16 pKa = 3.98PDD18 pKa = 3.83FKK20 pKa = 11.5GCVGTVEE27 pKa = 5.67DD28 pKa = 4.14IWFEE32 pKa = 4.14DD33 pKa = 4.45GIPYY37 pKa = 10.27EE38 pKa = 4.5FIRR41 pKa = 11.84VVGEE45 pKa = 4.13DD46 pKa = 3.52FSGTFLFNEE55 pKa = 5.65GYY57 pKa = 9.65IQNDD61 pKa = 3.67YY62 pKa = 11.42
Molecular weight: 7.05 kDa
Isoelectric point according different methods:
Protein with the highest isoelectric point:
>tr|M4MC93|M4MC93_9CAUD Uncharacterized protein OS=Vibrio phage helene 12B3 OX=573173 GN=VPBG_00149 PE=4 SV=1
MM1 pKa = 6.89SQRR4 pKa = 11.84TIKK7 pKa = 10.59ASQKK11 pKa = 9.64RR12 pKa = 11.84AQQRR16 pKa = 11.84IIRR19 pKa = 11.84NKK21 pKa = 9.53SMAAMRR27 pKa = 11.84VKK29 pKa = 10.45SQPQDD34 pKa = 3.15RR35 pKa = 11.84AEE37 pKa = 3.96VLSTIKK43 pKa = 10.37RR44 pKa = 11.84INVVRR49 pKa = 11.84GG50 pKa = 3.23
MM1 pKa = 6.89SQRR4 pKa = 11.84TIKK7 pKa = 10.59ASQKK11 pKa = 9.64RR12 pKa = 11.84AQQRR16 pKa = 11.84IIRR19 pKa = 11.84NKK21 pKa = 9.53SMAAMRR27 pKa = 11.84VKK29 pKa = 10.45SQPQDD34 pKa = 3.15RR35 pKa = 11.84AEE37 pKa = 3.96VLSTIKK43 pKa = 10.37RR44 pKa = 11.84INVVRR49 pKa = 11.84GG50 pKa = 3.23
Molecular weight: 5.77 kDa
Isoelectric point according different methods:
Peptides (in silico digests for buttom-up proteomics)
Below you can find in silico digests of the whole proteome with Trypsin, Chymotrypsin, Trypsin+LysC, LysN, ArgC proteases suitable for different mass spec machines.| Try ESI |
 |
|---|
| ChTry ESI |
|
|---|
| ArgC ESI |
|
|---|
| LysN ESI |
|
|---|
| TryLysC ESI |
|
|---|
| Try MALDI |
|
|---|
| ChTry MALDI |
|
|---|
| ArgC MALDI |
|
|---|
| LysN MALDI |
|
|---|
| TryLysC MALDI |
|
|---|
| Try LTQ |
|
|---|
| ChTry LTQ |
|
|---|
| ArgC LTQ |
|
|---|
| LysN LTQ |
|
|---|
| TryLysC LTQ |
|
|---|
| Try MSlow |
|
|---|
| ChTry MSlow |
|
|---|
| ArgC MSlow |
|
|---|
| LysN MSlow |
|
|---|
| TryLysC MSlow |
|
|---|
| Try MShigh |
|
|---|
| ChTry MShigh |
|
|---|
| ArgC MShigh |
|
|---|
| LysN MShigh |
|
|---|
| TryLysC MShigh |
|
|---|
General Statistics
Number of major isoforms |
Number of additional isoforms |
Number of all proteins |
Number of amino acids |
Min. Seq. Length |
Max. Seq. Length |
Avg. Seq. Length |
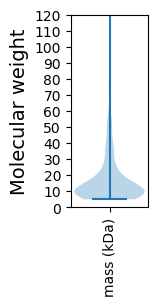
Avg. Mol. Weight |
|---|---|---|---|---|---|---|---|
0 |
39730 |
42 |
1079 |
151.1 |
17.28 |
Amino acid frequency
Ala |
Cys |
Asp |
Glu |
Phe |
Gly |
His |
Ile |
Lys |
Leu |
|---|---|---|---|---|---|---|---|---|---|
4.923 ± 0.212 | 1.84 ± 0.1 |
6.597 ± 0.139 | 8.137 ± 0.191 |
4.249 ± 0.108 | 6.32 ± 0.149 |
2.006 ± 0.093 | 5.719 ± 0.126 |
8.024 ± 0.212 | 8.58 ± 0.185 |
Met |
Asn |
Gln |
Pro |
Arg |
Ser |
Thr |
Val |
Trp |
Tyr |
|---|---|---|---|---|---|---|---|---|---|
2.686 ± 0.108 | 4.928 ± 0.138 |
2.927 ± 0.101 | 3.549 ± 0.1 |
4.196 ± 0.121 | 6.587 ± 0.168 |
6.139 ± 0.158 | 6.662 ± 0.15 |
1.611 ± 0.071 | 4.319 ± 0.124 |
Most of the basic statistics you can see at this page can be downloaded from this CSV file
See this proteome in:

Proteome-pI is available under Creative Commons Attribution-NoDerivs license, for more details see here
| Reference: Kozlowski LP. Proteome-pI 2.0: Proteome Isoelectric Point Database Update. Nucleic Acids Res. 2021, doi: 10.1093/nar/gkab944 | Contact: Lukasz P. Kozlowski |