Serratia phage PS2
Taxonomy: Viruses; Duplodnaviria; Heunggongvirae; Uroviricota; Caudoviricetes; Caudovirales; Myoviridae; Muldoonvirus; Serratia virus PS2
Average proteome isoelectric point is 6.24
Get precalculated fractions of proteins
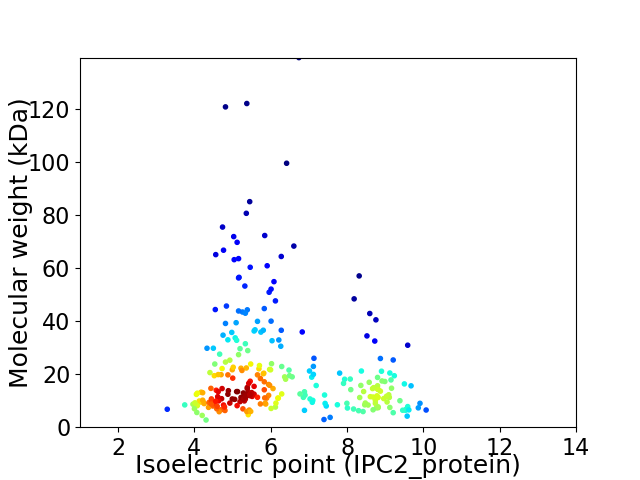
Virtual 2D-PAGE plot for 275 proteins (isoelectric point calculated using IPC2_protein)
Get csv file with sequences according to given criteria:
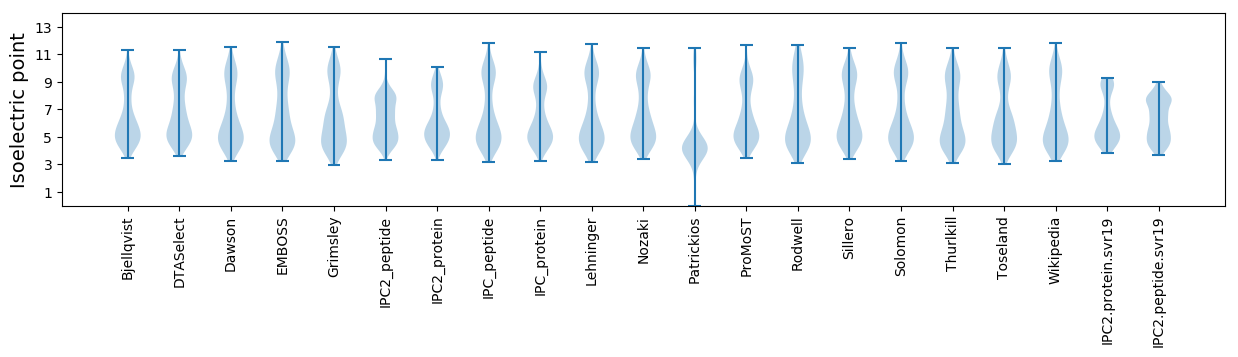
* You can choose from 21 different methods for calculating isoelectric point
Summary statistics related to proteome-wise predictions
Protein with the lowest isoelectric point:
>tr|A0A023W543|A0A023W543_9CAUD Uncharacterized protein OS=Serratia phage PS2 OX=1481112 GN=PS2_134 PE=4 SV=1
MM1 pKa = 7.83AIAICIKK8 pKa = 10.51SEE10 pKa = 3.94SCDD13 pKa = 3.5KK14 pKa = 11.11YY15 pKa = 10.76IYY17 pKa = 10.47AYY19 pKa = 8.84DD20 pKa = 3.35TGTPVEE26 pKa = 4.44TIKK29 pKa = 11.21EE30 pKa = 4.05EE31 pKa = 4.13LLGDD35 pKa = 3.63MDD37 pKa = 4.7MFAPICEE44 pKa = 4.26WEE46 pKa = 4.26YY47 pKa = 11.52SVSQSSMDD55 pKa = 3.49VNGDD59 pKa = 3.17IDD61 pKa = 4.49NMMSGIFDD69 pKa = 4.02ASWEE73 pKa = 4.21GRR75 pKa = 3.57
MM1 pKa = 7.83AIAICIKK8 pKa = 10.51SEE10 pKa = 3.94SCDD13 pKa = 3.5KK14 pKa = 11.11YY15 pKa = 10.76IYY17 pKa = 10.47AYY19 pKa = 8.84DD20 pKa = 3.35TGTPVEE26 pKa = 4.44TIKK29 pKa = 11.21EE30 pKa = 4.05EE31 pKa = 4.13LLGDD35 pKa = 3.63MDD37 pKa = 4.7MFAPICEE44 pKa = 4.26WEE46 pKa = 4.26YY47 pKa = 11.52SVSQSSMDD55 pKa = 3.49VNGDD59 pKa = 3.17IDD61 pKa = 4.49NMMSGIFDD69 pKa = 4.02ASWEE73 pKa = 4.21GRR75 pKa = 3.57
Molecular weight: 8.42 kDa
Isoelectric point according different methods:
Protein with the highest isoelectric point:
>tr|A0A023W6M2|A0A023W6M2_9CAUD Dihydrofolate reductase OS=Serratia phage PS2 OX=1481112 GN=frd PE=3 SV=1
MM1 pKa = 7.13TMKK4 pKa = 10.33HH5 pKa = 6.03LPLIVSVLMATLTAAMLGITMTLGAVEE32 pKa = 5.3AISHH36 pKa = 5.32RR37 pKa = 11.84TFAEE41 pKa = 3.86LLGWSGLFVVIGLVASRR58 pKa = 11.84RR59 pKa = 11.84IKK61 pKa = 10.69
MM1 pKa = 7.13TMKK4 pKa = 10.33HH5 pKa = 6.03LPLIVSVLMATLTAAMLGITMTLGAVEE32 pKa = 5.3AISHH36 pKa = 5.32RR37 pKa = 11.84TFAEE41 pKa = 3.86LLGWSGLFVVIGLVASRR58 pKa = 11.84RR59 pKa = 11.84IKK61 pKa = 10.69
Molecular weight: 6.54 kDa
Isoelectric point according different methods:
Peptides (in silico digests for buttom-up proteomics)
Below you can find in silico digests of the whole proteome with Trypsin, Chymotrypsin, Trypsin+LysC, LysN, ArgC proteases suitable for different mass spec machines.| Try ESI |
 |
|---|
| ChTry ESI |
|
|---|
| ArgC ESI |
|
|---|
| LysN ESI |
|
|---|
| TryLysC ESI |
|
|---|
| Try MALDI |
|
|---|
| ChTry MALDI |
|
|---|
| ArgC MALDI |
|
|---|
| LysN MALDI |
|
|---|
| TryLysC MALDI |
|
|---|
| Try LTQ |
|
|---|
| ChTry LTQ |
|
|---|
| ArgC LTQ |
|
|---|
| LysN LTQ |
|
|---|
| TryLysC LTQ |
|
|---|
| Try MSlow |
|
|---|
| ChTry MSlow |
|
|---|
| ArgC MSlow |
|
|---|
| LysN MSlow |
|
|---|
| TryLysC MSlow |
|
|---|
| Try MShigh |
|
|---|
| ChTry MShigh |
|
|---|
| ArgC MShigh |
|
|---|
| LysN MShigh |
|
|---|
| TryLysC MShigh |
|
|---|
General Statistics
Number of major isoforms |
Number of additional isoforms |
Number of all proteins |
Number of amino acids |
Min. Seq. Length |
Max. Seq. Length |
Avg. Seq. Length |
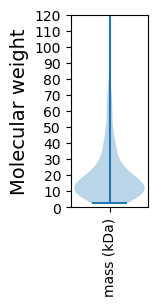
Avg. Mol. Weight |
|---|---|---|---|---|---|---|---|
0 |
52757 |
20 |
1295 |
191.8 |
21.73 |
Amino acid frequency
Ala |
Cys |
Asp |
Glu |
Phe |
Gly |
His |
Ile |
Lys |
Leu |
|---|---|---|---|---|---|---|---|---|---|
6.966 ± 0.172 | 1.069 ± 0.061 |
6.382 ± 0.108 | 7.102 ± 0.174 |
4.276 ± 0.115 | 6.265 ± 0.191 |
1.958 ± 0.075 | 6.689 ± 0.12 |
7.262 ± 0.183 | 7.561 ± 0.156 |
Met |
Asn |
Gln |
Pro |
Arg |
Ser |
Thr |
Val |
Trp |
Tyr |
|---|---|---|---|---|---|---|---|---|---|
3.08 ± 0.093 | 5.029 ± 0.131 |
3.601 ± 0.098 | 3.694 ± 0.103 |
4.657 ± 0.099 | 6.409 ± 0.142 |
5.787 ± 0.179 | 6.795 ± 0.139 |
1.475 ± 0.062 | 3.943 ± 0.106 |
Most of the basic statistics you can see at this page can be downloaded from this CSV file
See this proteome in:

Proteome-pI is available under Creative Commons Attribution-NoDerivs license, for more details see here
| Reference: Kozlowski LP. Proteome-pI 2.0: Proteome Isoelectric Point Database Update. Nucleic Acids Res. 2021, doi: 10.1093/nar/gkab944 | Contact: Lukasz P. Kozlowski |