Streptococcus virus ALQ132
Taxonomy: Viruses; Duplodnaviria; Heunggongvirae; Uroviricota; Caudoviricetes; Caudovirales; Siphoviridae; Brussowvirus
Average proteome isoelectric point is 6.66
Get precalculated fractions of proteins
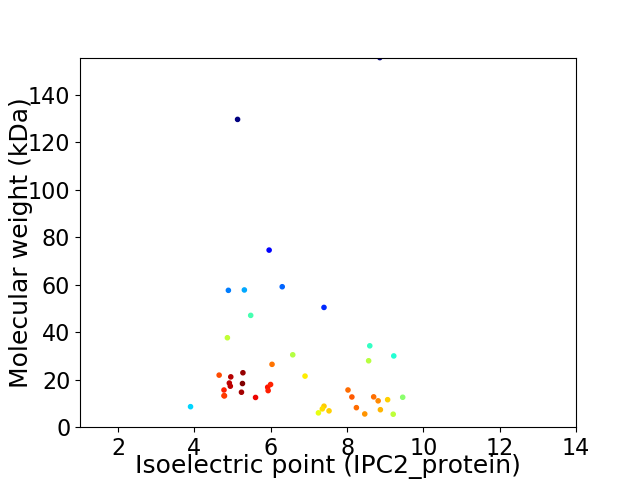
Virtual 2D-PAGE plot for 44 proteins (isoelectric point calculated using IPC2_protein)
Get csv file with sequences according to given criteria:
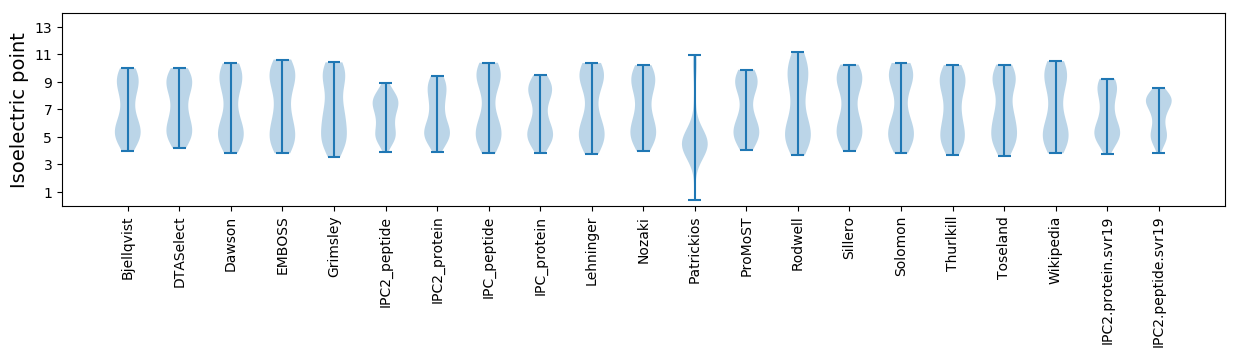
* You can choose from 21 different methods for calculating isoelectric point
Summary statistics related to proteome-wise predictions
Protein with the lowest isoelectric point:
>tr|C9W9J9|C9W9J9_9CAUD Uncharacterized protein OS=Streptococcus virus ALQ132 OX=682370 PE=4 SV=1
MM1 pKa = 7.12VNWVDD6 pKa = 4.58KK7 pKa = 11.1DD8 pKa = 4.24GNDD11 pKa = 3.97LPDD14 pKa = 4.26GADD17 pKa = 3.29QEE19 pKa = 5.13FKK21 pKa = 11.28AGMFFSFAGDD31 pKa = 3.4EE32 pKa = 4.36TNITDD37 pKa = 3.65TGEE40 pKa = 3.72GGYY43 pKa = 10.63YY44 pKa = 9.66GGYY47 pKa = 8.9YY48 pKa = 9.56FRR50 pKa = 11.84KK51 pKa = 9.96FEE53 pKa = 4.13FGQFGTVWLSCWNKK67 pKa = 10.66DD68 pKa = 3.89DD69 pKa = 5.14LVNYY73 pKa = 7.38YY74 pKa = 8.26QQ75 pKa = 4.22
MM1 pKa = 7.12VNWVDD6 pKa = 4.58KK7 pKa = 11.1DD8 pKa = 4.24GNDD11 pKa = 3.97LPDD14 pKa = 4.26GADD17 pKa = 3.29QEE19 pKa = 5.13FKK21 pKa = 11.28AGMFFSFAGDD31 pKa = 3.4EE32 pKa = 4.36TNITDD37 pKa = 3.65TGEE40 pKa = 3.72GGYY43 pKa = 10.63YY44 pKa = 9.66GGYY47 pKa = 8.9YY48 pKa = 9.56FRR50 pKa = 11.84KK51 pKa = 9.96FEE53 pKa = 4.13FGQFGTVWLSCWNKK67 pKa = 10.66DD68 pKa = 3.89DD69 pKa = 5.14LVNYY73 pKa = 7.38YY74 pKa = 8.26QQ75 pKa = 4.22
Molecular weight: 8.64 kDa
Isoelectric point according different methods:
Protein with the highest isoelectric point:
>tr|C9W9L2|C9W9L2_9CAUD Uncharacterized protein OS=Streptococcus virus ALQ132 OX=682370 PE=4 SV=1
MM1 pKa = 7.55GLTVTCCDD9 pKa = 3.57NLRR12 pKa = 11.84LLSNHH17 pKa = 5.68NHH19 pKa = 5.11YY20 pKa = 11.07CCFLRR25 pKa = 11.84LVFVPIKK32 pKa = 10.46IEE34 pKa = 3.61IMPINWLIFSWVKK47 pKa = 9.88KK48 pKa = 9.58IKK50 pKa = 10.41RR51 pKa = 11.84FLSIFNPTYY60 pKa = 10.42RR61 pKa = 4.35
MM1 pKa = 7.55GLTVTCCDD9 pKa = 3.57NLRR12 pKa = 11.84LLSNHH17 pKa = 5.68NHH19 pKa = 5.11YY20 pKa = 11.07CCFLRR25 pKa = 11.84LVFVPIKK32 pKa = 10.46IEE34 pKa = 3.61IMPINWLIFSWVKK47 pKa = 9.88KK48 pKa = 9.58IKK50 pKa = 10.41RR51 pKa = 11.84FLSIFNPTYY60 pKa = 10.42RR61 pKa = 4.35
Molecular weight: 7.36 kDa
Isoelectric point according different methods:
Peptides (in silico digests for buttom-up proteomics)
Below you can find in silico digests of the whole proteome with Trypsin, Chymotrypsin, Trypsin+LysC, LysN, ArgC proteases suitable for different mass spec machines.| Try ESI |
 |
|---|
| ChTry ESI |
|
|---|
| ArgC ESI |
|
|---|
| LysN ESI |
|
|---|
| TryLysC ESI |
|
|---|
| Try MALDI |
|
|---|
| ChTry MALDI |
|
|---|
| ArgC MALDI |
|
|---|
| LysN MALDI |
|
|---|
| TryLysC MALDI |
|
|---|
| Try LTQ |
|
|---|
| ChTry LTQ |
|
|---|
| ArgC LTQ |
|
|---|
| LysN LTQ |
|
|---|
| TryLysC LTQ |
|
|---|
| Try MSlow |
|
|---|
| ChTry MSlow |
|
|---|
| ArgC MSlow |
|
|---|
| LysN MSlow |
|
|---|
| TryLysC MSlow |
|
|---|
| Try MShigh |
|
|---|
| ChTry MShigh |
|
|---|
| ArgC MShigh |
|
|---|
| LysN MShigh |
|
|---|
| TryLysC MShigh |
|
|---|
General Statistics
Number of major isoforms |
Number of additional isoforms |
Number of all proteins |
Number of amino acids |
Min. Seq. Length |
Max. Seq. Length |
Avg. Seq. Length |
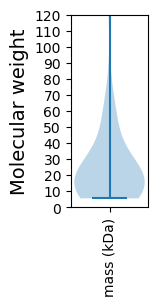
Avg. Mol. Weight |
|---|---|---|---|---|---|---|---|
0 |
10903 |
46 |
1534 |
247.8 |
27.76 |
Amino acid frequency
Ala |
Cys |
Asp |
Glu |
Phe |
Gly |
His |
Ile |
Lys |
Leu |
|---|---|---|---|---|---|---|---|---|---|
7.457 ± 1.267 | 0.633 ± 0.159 |
6.301 ± 0.543 | 6.374 ± 0.773 |
4.292 ± 0.188 | 7.053 ± 0.572 |
1.238 ± 0.194 | 6.86 ± 0.447 |
7.979 ± 0.687 | 7.677 ± 0.356 |
Met |
Asn |
Gln |
Pro |
Arg |
Ser |
Thr |
Val |
Trp |
Tyr |
|---|---|---|---|---|---|---|---|---|---|
2.559 ± 0.344 | 5.76 ± 0.468 |
2.807 ± 0.267 | 3.715 ± 0.299 |
4.338 ± 0.457 | 6.86 ± 0.69 |
6.457 ± 0.402 | 6.512 ± 0.253 |
1.202 ± 0.203 | 3.926 ± 0.506 |
Most of the basic statistics you can see at this page can be downloaded from this CSV file
See this proteome in:

Proteome-pI is available under Creative Commons Attribution-NoDerivs license, for more details see here
| Reference: Kozlowski LP. Proteome-pI 2.0: Proteome Isoelectric Point Database Update. Nucleic Acids Res. 2021, doi: 10.1093/nar/gkab944 | Contact: Lukasz P. Kozlowski |