Lysobacter maris
Taxonomy: cellular organisms; Bacteria; Proteobacteria; Gammaproteobacteria; Xanthomonadales; Xanthomonadaceae; Lysobacter
Average proteome isoelectric point is 6.37
Get precalculated fractions of proteins
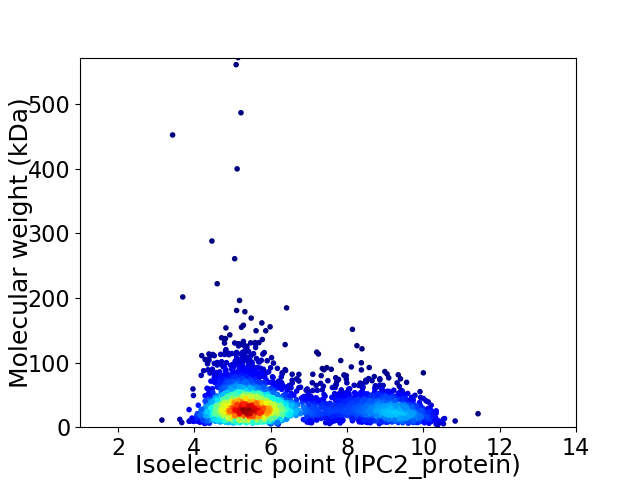
Virtual 2D-PAGE plot for 3120 proteins (isoelectric point calculated using IPC2_protein)
Get csv file with sequences according to given criteria:
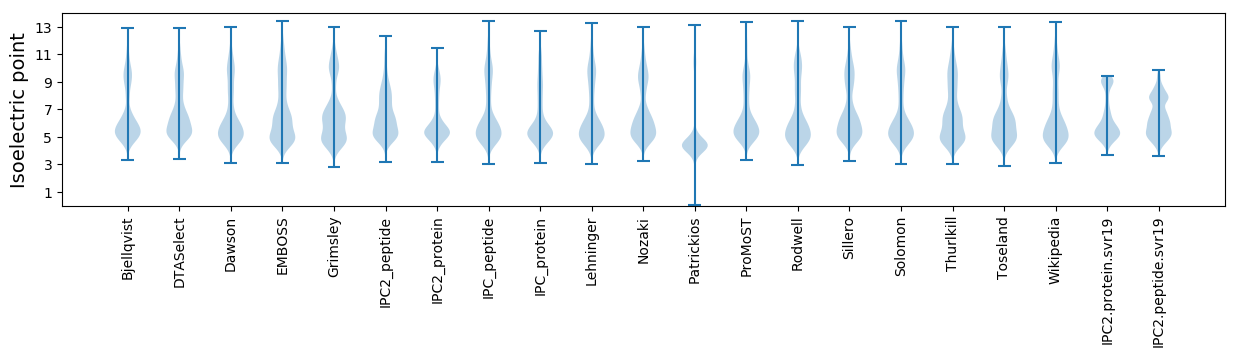
* You can choose from 21 different methods for calculating isoelectric point
Summary statistics related to proteome-wise predictions
Protein with the lowest isoelectric point:
>tr|A0A2U9TC59|A0A2U9TC59_9GAMM DUF218 domain-containing protein OS=Lysobacter maris OX=1605891 GN=C9I47_3123 PE=4 SV=1
MM1 pKa = 7.57SSQHH5 pKa = 5.36TAFHH9 pKa = 6.63APGGRR14 pKa = 11.84IQGIRR19 pKa = 11.84EE20 pKa = 3.86TAPAPLAALTAIATMATMLAMGQARR45 pKa = 11.84AGEE48 pKa = 4.18LSGSVSLTSDD58 pKa = 3.38YY59 pKa = 11.02LFRR62 pKa = 11.84GITQTDD68 pKa = 3.82EE69 pKa = 4.27EE70 pKa = 4.71PALQAGVEE78 pKa = 4.19YY79 pKa = 8.9ATDD82 pKa = 3.23SGFYY86 pKa = 10.08AGVWGSSISWLSDD99 pKa = 2.95SDD101 pKa = 4.18PDD103 pKa = 4.07ISSQLEE109 pKa = 3.74LDD111 pKa = 4.08GYY113 pKa = 10.98LGLRR117 pKa = 11.84GEE119 pKa = 4.51FADD122 pKa = 5.7SGVSWDD128 pKa = 3.79VGAIHH133 pKa = 6.21YY134 pKa = 7.53WYY136 pKa = 9.81PGDD139 pKa = 3.8YY140 pKa = 10.42PSGFNSADD148 pKa = 3.33TTEE151 pKa = 4.55VYY153 pKa = 10.66AGLGWSVLSAKK164 pKa = 10.24YY165 pKa = 10.44SYY167 pKa = 11.62ALTDD171 pKa = 3.83LFGIPDD177 pKa = 3.72SDD179 pKa = 3.78GSHH182 pKa = 6.78ALDD185 pKa = 5.49LGASWEE191 pKa = 4.43FVPSWTLDD199 pKa = 3.48AAVGKK204 pKa = 9.84QWVEE208 pKa = 3.79NLDD211 pKa = 4.0GGDD214 pKa = 3.42YY215 pKa = 10.55AYY217 pKa = 9.69WKK219 pKa = 10.28LGVGKK224 pKa = 10.37AFDD227 pKa = 3.74NGIDD231 pKa = 4.28VAVAWNDD238 pKa = 3.02NDD240 pKa = 5.95LIGPDD245 pKa = 3.38EE246 pKa = 4.38TLTVAITKK254 pKa = 10.07SFF256 pKa = 3.29
MM1 pKa = 7.57SSQHH5 pKa = 5.36TAFHH9 pKa = 6.63APGGRR14 pKa = 11.84IQGIRR19 pKa = 11.84EE20 pKa = 3.86TAPAPLAALTAIATMATMLAMGQARR45 pKa = 11.84AGEE48 pKa = 4.18LSGSVSLTSDD58 pKa = 3.38YY59 pKa = 11.02LFRR62 pKa = 11.84GITQTDD68 pKa = 3.82EE69 pKa = 4.27EE70 pKa = 4.71PALQAGVEE78 pKa = 4.19YY79 pKa = 8.9ATDD82 pKa = 3.23SGFYY86 pKa = 10.08AGVWGSSISWLSDD99 pKa = 2.95SDD101 pKa = 4.18PDD103 pKa = 4.07ISSQLEE109 pKa = 3.74LDD111 pKa = 4.08GYY113 pKa = 10.98LGLRR117 pKa = 11.84GEE119 pKa = 4.51FADD122 pKa = 5.7SGVSWDD128 pKa = 3.79VGAIHH133 pKa = 6.21YY134 pKa = 7.53WYY136 pKa = 9.81PGDD139 pKa = 3.8YY140 pKa = 10.42PSGFNSADD148 pKa = 3.33TTEE151 pKa = 4.55VYY153 pKa = 10.66AGLGWSVLSAKK164 pKa = 10.24YY165 pKa = 10.44SYY167 pKa = 11.62ALTDD171 pKa = 3.83LFGIPDD177 pKa = 3.72SDD179 pKa = 3.78GSHH182 pKa = 6.78ALDD185 pKa = 5.49LGASWEE191 pKa = 4.43FVPSWTLDD199 pKa = 3.48AAVGKK204 pKa = 9.84QWVEE208 pKa = 3.79NLDD211 pKa = 4.0GGDD214 pKa = 3.42YY215 pKa = 10.55AYY217 pKa = 9.69WKK219 pKa = 10.28LGVGKK224 pKa = 10.37AFDD227 pKa = 3.74NGIDD231 pKa = 4.28VAVAWNDD238 pKa = 3.02NDD240 pKa = 5.95LIGPDD245 pKa = 3.38EE246 pKa = 4.38TLTVAITKK254 pKa = 10.07SFF256 pKa = 3.29
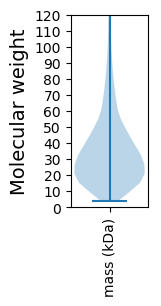
Molecular weight: 27.2 kDa
Isoelectric point according different methods:
Protein with the highest isoelectric point:
>tr|A0A2U9TK15|A0A2U9TK15_9GAMM Short-chain fatty acid transporter OS=Lysobacter maris OX=1605891 GN=C9I47_2654 PE=4 SV=1
MM1 pKa = 7.05ATKK4 pKa = 10.25KK5 pKa = 10.11AAKK8 pKa = 9.45KK9 pKa = 10.34KK10 pKa = 9.45PAAKK14 pKa = 9.97KK15 pKa = 9.35AAKK18 pKa = 9.77KK19 pKa = 9.31VAKK22 pKa = 10.13KK23 pKa = 9.77SAARR27 pKa = 11.84KK28 pKa = 6.29TVKK31 pKa = 10.32KK32 pKa = 10.01AAKK35 pKa = 9.17KK36 pKa = 9.25AAKK39 pKa = 8.65KK40 pKa = 7.86TVRR43 pKa = 11.84KK44 pKa = 9.12AAAKK48 pKa = 8.44KK49 pKa = 7.75TVRR52 pKa = 11.84KK53 pKa = 9.01AAKK56 pKa = 8.7KK57 pKa = 7.36TVKK60 pKa = 10.18KK61 pKa = 10.42AAAKK65 pKa = 8.5KK66 pKa = 7.09TAKK69 pKa = 10.17KK70 pKa = 9.86AAKK73 pKa = 8.57KK74 pKa = 7.22TAKK77 pKa = 9.98KK78 pKa = 9.81AAKK81 pKa = 8.57KK82 pKa = 7.77TVRR85 pKa = 11.84KK86 pKa = 9.23AAAKK90 pKa = 8.48KK91 pKa = 7.19TAKK94 pKa = 10.06KK95 pKa = 9.87AAKK98 pKa = 8.71KK99 pKa = 7.79TVKK102 pKa = 10.16KK103 pKa = 10.12AAKK106 pKa = 8.27KK107 pKa = 7.53TVRR110 pKa = 11.84KK111 pKa = 9.23AAAKK115 pKa = 8.48KK116 pKa = 7.19TAKK119 pKa = 10.06KK120 pKa = 9.87AAKK123 pKa = 8.71KK124 pKa = 7.79TVKK127 pKa = 10.29KK128 pKa = 10.09AAKK131 pKa = 8.25KK132 pKa = 6.92TARR135 pKa = 11.84KK136 pKa = 9.07AATKK140 pKa = 8.86KK141 pKa = 7.88TAKK144 pKa = 9.96KK145 pKa = 9.75AAKK148 pKa = 8.71KK149 pKa = 7.79TVKK152 pKa = 10.16KK153 pKa = 10.18AAKK156 pKa = 8.65KK157 pKa = 7.59TVKK160 pKa = 10.23KK161 pKa = 10.11AAKK164 pKa = 9.75KK165 pKa = 8.7ATKK168 pKa = 10.17KK169 pKa = 9.92SAKK172 pKa = 9.83KK173 pKa = 9.46PARR176 pKa = 11.84KK177 pKa = 6.86TAKK180 pKa = 10.04RR181 pKa = 11.84AAKK184 pKa = 9.59KK185 pKa = 9.68AAPAAMPATPAPMII199 pKa = 4.39
MM1 pKa = 7.05ATKK4 pKa = 10.25KK5 pKa = 10.11AAKK8 pKa = 9.45KK9 pKa = 10.34KK10 pKa = 9.45PAAKK14 pKa = 9.97KK15 pKa = 9.35AAKK18 pKa = 9.77KK19 pKa = 9.31VAKK22 pKa = 10.13KK23 pKa = 9.77SAARR27 pKa = 11.84KK28 pKa = 6.29TVKK31 pKa = 10.32KK32 pKa = 10.01AAKK35 pKa = 9.17KK36 pKa = 9.25AAKK39 pKa = 8.65KK40 pKa = 7.86TVRR43 pKa = 11.84KK44 pKa = 9.12AAAKK48 pKa = 8.44KK49 pKa = 7.75TVRR52 pKa = 11.84KK53 pKa = 9.01AAKK56 pKa = 8.7KK57 pKa = 7.36TVKK60 pKa = 10.18KK61 pKa = 10.42AAAKK65 pKa = 8.5KK66 pKa = 7.09TAKK69 pKa = 10.17KK70 pKa = 9.86AAKK73 pKa = 8.57KK74 pKa = 7.22TAKK77 pKa = 9.98KK78 pKa = 9.81AAKK81 pKa = 8.57KK82 pKa = 7.77TVRR85 pKa = 11.84KK86 pKa = 9.23AAAKK90 pKa = 8.48KK91 pKa = 7.19TAKK94 pKa = 10.06KK95 pKa = 9.87AAKK98 pKa = 8.71KK99 pKa = 7.79TVKK102 pKa = 10.16KK103 pKa = 10.12AAKK106 pKa = 8.27KK107 pKa = 7.53TVRR110 pKa = 11.84KK111 pKa = 9.23AAAKK115 pKa = 8.48KK116 pKa = 7.19TAKK119 pKa = 10.06KK120 pKa = 9.87AAKK123 pKa = 8.71KK124 pKa = 7.79TVKK127 pKa = 10.29KK128 pKa = 10.09AAKK131 pKa = 8.25KK132 pKa = 6.92TARR135 pKa = 11.84KK136 pKa = 9.07AATKK140 pKa = 8.86KK141 pKa = 7.88TAKK144 pKa = 9.96KK145 pKa = 9.75AAKK148 pKa = 8.71KK149 pKa = 7.79TVKK152 pKa = 10.16KK153 pKa = 10.18AAKK156 pKa = 8.65KK157 pKa = 7.59TVKK160 pKa = 10.23KK161 pKa = 10.11AAKK164 pKa = 9.75KK165 pKa = 8.7ATKK168 pKa = 10.17KK169 pKa = 9.92SAKK172 pKa = 9.83KK173 pKa = 9.46PARR176 pKa = 11.84KK177 pKa = 6.86TAKK180 pKa = 10.04RR181 pKa = 11.84AAKK184 pKa = 9.59KK185 pKa = 9.68AAPAAMPATPAPMII199 pKa = 4.39
Molecular weight: 20.82 kDa
Isoelectric point according different methods:
Peptides (in silico digests for buttom-up proteomics)
Below you can find in silico digests of the whole proteome with Trypsin, Chymotrypsin, Trypsin+LysC, LysN, ArgC proteases suitable for different mass spec machines.| Try ESI |
 |
|---|
| ChTry ESI |
|
|---|
| ArgC ESI |
|
|---|
| LysN ESI |
|
|---|
| TryLysC ESI |
|
|---|
| Try MALDI |
|
|---|
| ChTry MALDI |
|
|---|
| ArgC MALDI |
|
|---|
| LysN MALDI |
|
|---|
| TryLysC MALDI |
|
|---|
| Try LTQ |
|
|---|
| ChTry LTQ |
|
|---|
| ArgC LTQ |
|
|---|
| LysN LTQ |
|
|---|
| TryLysC LTQ |
|
|---|
| Try MSlow |
|
|---|
| ChTry MSlow |
|
|---|
| ArgC MSlow |
|
|---|
| LysN MSlow |
|
|---|
| TryLysC MSlow |
|
|---|
| Try MShigh |
|
|---|
| ChTry MShigh |
|
|---|
| ArgC MShigh |
|
|---|
| LysN MShigh |
|
|---|
| TryLysC MShigh |
|
|---|
General Statistics
Number of major isoforms |
Number of additional isoforms |
Number of all proteins |
Number of amino acids |
Min. Seq. Length |
Max. Seq. Length |
Avg. Seq. Length |
Avg. Mol. Weight |
|---|---|---|---|---|---|---|---|
0 |
1080331 |
31 |
5326 |
346.3 |
37.54 |
Amino acid frequency
Ala |
Cys |
Asp |
Glu |
Phe |
Gly |
His |
Ile |
Lys |
Leu |
|---|---|---|---|---|---|---|---|---|---|
13.313 ± 0.063 | 0.821 ± 0.012 |
6.293 ± 0.038 | 5.602 ± 0.047 |
3.287 ± 0.028 | 8.945 ± 0.041 |
2.241 ± 0.021 | 4.035 ± 0.028 |
2.268 ± 0.038 | 10.603 ± 0.067 |
Met |
Asn |
Gln |
Pro |
Arg |
Ser |
Thr |
Val |
Trp |
Tyr |
|---|---|---|---|---|---|---|---|---|---|
2.143 ± 0.022 | 2.343 ± 0.033 |
5.44 ± 0.033 | 3.355 ± 0.026 |
8.129 ± 0.061 | 5.141 ± 0.04 |
4.757 ± 0.084 | 7.395 ± 0.035 |
1.537 ± 0.022 | 2.354 ± 0.026 |
Most of the basic statistics you can see at this page can be downloaded from this CSV file
See this proteome in:

Proteome-pI is available under Creative Commons Attribution-NoDerivs license, for more details see here
| Reference: Kozlowski LP. Proteome-pI 2.0: Proteome Isoelectric Point Database Update. Nucleic Acids Res. 2021, doi: 10.1093/nar/gkab944 | Contact: Lukasz P. Kozlowski |