Lachnospiraceae bacterium 2_1_46FAA
Taxonomy: cellular organisms; Bacteria; Terrabacteria group; Firmicutes; Clostridia; Eubacteriales; Lachnospiraceae; unclassified Lachnospiraceae
Average proteome isoelectric point is 6.29
Get precalculated fractions of proteins
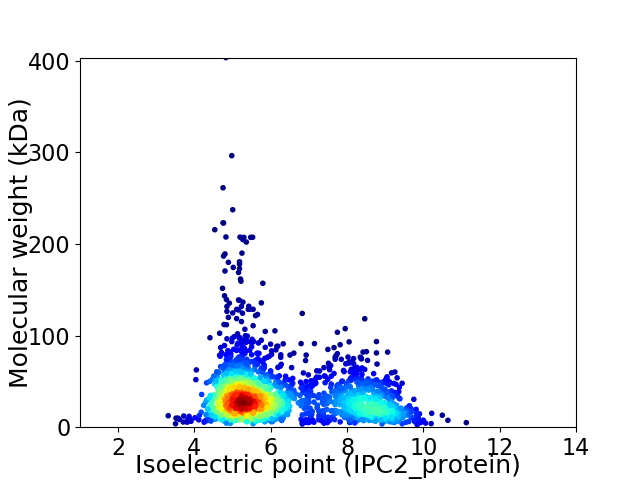
Virtual 2D-PAGE plot for 2056 proteins (isoelectric point calculated using IPC2_protein)
Get csv file with sequences according to given criteria:
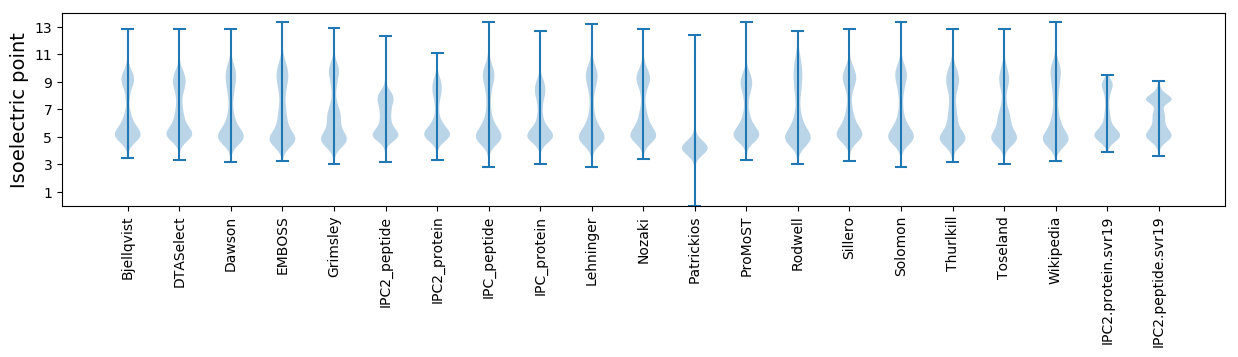
* You can choose from 21 different methods for calculating isoelectric point
Summary statistics related to proteome-wise predictions
Protein with the lowest isoelectric point:
>tr|F3BD92|F3BD92_9FIRM Aldo_ket_red domain-containing protein OS=Lachnospiraceae bacterium 2_1_46FAA OX=742723 GN=HMPREF9477_01912 PE=4 SV=1
MM1 pKa = 7.51KK2 pKa = 10.16KK3 pKa = 10.12YY4 pKa = 10.24VCEE7 pKa = 4.06PCGYY11 pKa = 10.75VYY13 pKa = 10.63DD14 pKa = 4.92PEE16 pKa = 6.71LGDD19 pKa = 4.01PDD21 pKa = 4.87GGIAPGTAFEE31 pKa = 5.97DD32 pKa = 4.28IPDD35 pKa = 3.79DD36 pKa = 4.06WVCPICGLGKK46 pKa = 10.3DD47 pKa = 3.93VFVEE51 pKa = 4.39EE52 pKa = 4.45
MM1 pKa = 7.51KK2 pKa = 10.16KK3 pKa = 10.12YY4 pKa = 10.24VCEE7 pKa = 4.06PCGYY11 pKa = 10.75VYY13 pKa = 10.63DD14 pKa = 4.92PEE16 pKa = 6.71LGDD19 pKa = 4.01PDD21 pKa = 4.87GGIAPGTAFEE31 pKa = 5.97DD32 pKa = 4.28IPDD35 pKa = 3.79DD36 pKa = 4.06WVCPICGLGKK46 pKa = 10.3DD47 pKa = 3.93VFVEE51 pKa = 4.39EE52 pKa = 4.45
Molecular weight: 5.65 kDa
Isoelectric point according different methods:
Protein with the highest isoelectric point:
>tr|F3BCC1|F3BCC1_9FIRM DNA gyrase subunit A OS=Lachnospiraceae bacterium 2_1_46FAA OX=742723 GN=gyrA PE=3 SV=1
MM1 pKa = 7.67KK2 pKa = 8.72MTFQPKK8 pKa = 8.86KK9 pKa = 8.2RR10 pKa = 11.84SRR12 pKa = 11.84AKK14 pKa = 9.27VHH16 pKa = 5.81GFRR19 pKa = 11.84ARR21 pKa = 11.84MSTAGGRR28 pKa = 11.84KK29 pKa = 8.71VLAARR34 pKa = 11.84RR35 pKa = 11.84AKK37 pKa = 10.1GRR39 pKa = 11.84KK40 pKa = 8.83KK41 pKa = 10.63LSAA44 pKa = 3.95
MM1 pKa = 7.67KK2 pKa = 8.72MTFQPKK8 pKa = 8.86KK9 pKa = 8.2RR10 pKa = 11.84SRR12 pKa = 11.84AKK14 pKa = 9.27VHH16 pKa = 5.81GFRR19 pKa = 11.84ARR21 pKa = 11.84MSTAGGRR28 pKa = 11.84KK29 pKa = 8.71VLAARR34 pKa = 11.84RR35 pKa = 11.84AKK37 pKa = 10.1GRR39 pKa = 11.84KK40 pKa = 8.83KK41 pKa = 10.63LSAA44 pKa = 3.95
Molecular weight: 4.96 kDa
Isoelectric point according different methods:
Peptides (in silico digests for buttom-up proteomics)
Below you can find in silico digests of the whole proteome with Trypsin, Chymotrypsin, Trypsin+LysC, LysN, ArgC proteases suitable for different mass spec machines.| Try ESI |
 |
|---|
| ChTry ESI |
|
|---|
| ArgC ESI |
|
|---|
| LysN ESI |
|
|---|
| TryLysC ESI |
|
|---|
| Try MALDI |
|
|---|
| ChTry MALDI |
|
|---|
| ArgC MALDI |
|
|---|
| LysN MALDI |
|
|---|
| TryLysC MALDI |
|
|---|
| Try LTQ |
|
|---|
| ChTry LTQ |
|
|---|
| ArgC LTQ |
|
|---|
| LysN LTQ |
|
|---|
| TryLysC LTQ |
|
|---|
| Try MSlow |
|
|---|
| ChTry MSlow |
|
|---|
| ArgC MSlow |
|
|---|
| LysN MSlow |
|
|---|
| TryLysC MSlow |
|
|---|
| Try MShigh |
|
|---|
| ChTry MShigh |
|
|---|
| ArgC MShigh |
|
|---|
| LysN MShigh |
|
|---|
| TryLysC MShigh |
|
|---|
General Statistics
Number of major isoforms |
Number of additional isoforms |
Number of all proteins |
Number of amino acids |
Min. Seq. Length |
Max. Seq. Length |
Avg. Seq. Length |
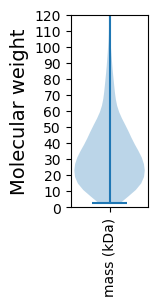
Avg. Mol. Weight |
|---|---|---|---|---|---|---|---|
0 |
667679 |
20 |
3699 |
324.7 |
36.62 |
Amino acid frequency
Ala |
Cys |
Asp |
Glu |
Phe |
Gly |
His |
Ile |
Lys |
Leu |
|---|---|---|---|---|---|---|---|---|---|
6.663 ± 0.056 | 1.32 ± 0.021 |
5.278 ± 0.049 | 8.539 ± 0.075 |
4.058 ± 0.04 | 6.955 ± 0.051 |
1.659 ± 0.023 | 7.637 ± 0.065 |
8.277 ± 0.048 | 8.616 ± 0.066 |
Met |
Asn |
Gln |
Pro |
Arg |
Ser |
Thr |
Val |
Trp |
Tyr |
|---|---|---|---|---|---|---|---|---|---|
2.975 ± 0.029 | 4.63 ± 0.046 |
3.005 ± 0.026 | 3.2 ± 0.027 |
4.023 ± 0.045 | 5.45 ± 0.036 |
5.599 ± 0.056 | 7.14 ± 0.043 |
0.862 ± 0.022 | 4.115 ± 0.041 |
Most of the basic statistics you can see at this page can be downloaded from this CSV file
See this proteome in:

Proteome-pI is available under Creative Commons Attribution-NoDerivs license, for more details see here
| Reference: Kozlowski LP. Proteome-pI 2.0: Proteome Isoelectric Point Database Update. Nucleic Acids Res. 2021, doi: 10.1093/nar/gkab944 | Contact: Lukasz P. Kozlowski |