Pseudomonas phage KPP22
Taxonomy: Viruses; Duplodnaviria; Heunggongvirae; Uroviricota; Caudoviricetes; Caudovirales; Myoviridae; Pbunavirus; unclassified Pbunavirus
Average proteome isoelectric point is 6.07
Get precalculated fractions of proteins
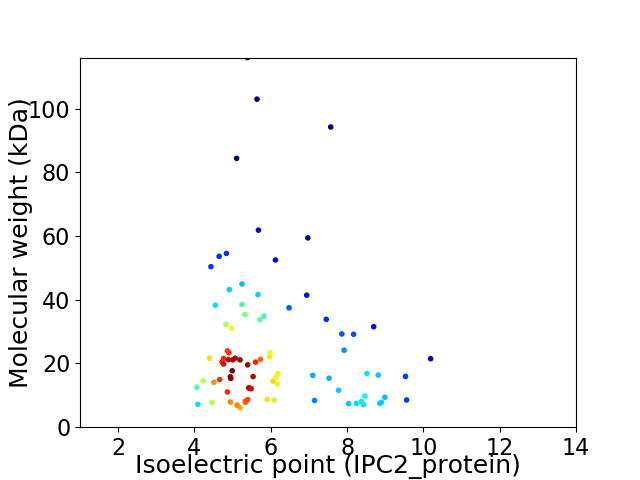
Virtual 2D-PAGE plot for 86 proteins (isoelectric point calculated using IPC2_protein)
Get csv file with sequences according to given criteria:
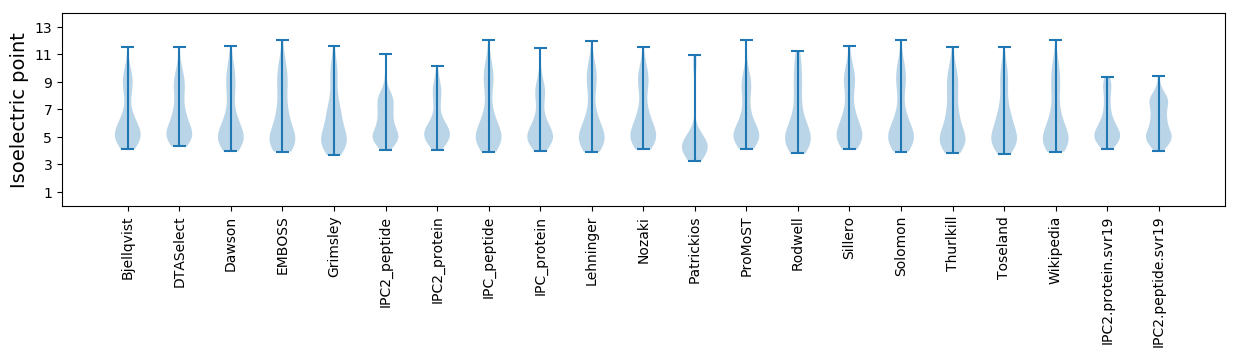
* You can choose from 21 different methods for calculating isoelectric point
Summary statistics related to proteome-wise predictions
Protein with the lowest isoelectric point:
>tr|A0A0U5A906|A0A0U5A906_BPK22 Uncharacterized protein OS=Pseudomonas phage KPP22 OX=1772250 PE=4 SV=1
MM1 pKa = 7.53SGHH4 pKa = 6.25SLFDD8 pKa = 3.96FEE10 pKa = 5.22VDD12 pKa = 3.95CNSATNSDD20 pKa = 3.62TMKK23 pKa = 10.0IDD25 pKa = 3.57PGSFYY30 pKa = 11.31VGFGFGATALSVLIYY45 pKa = 10.73VDD47 pKa = 4.22GVWVSEE53 pKa = 4.11RR54 pKa = 11.84TAWIPDD60 pKa = 3.61PKK62 pKa = 10.43EE63 pKa = 3.61ISPP66 pKa = 4.12
MM1 pKa = 7.53SGHH4 pKa = 6.25SLFDD8 pKa = 3.96FEE10 pKa = 5.22VDD12 pKa = 3.95CNSATNSDD20 pKa = 3.62TMKK23 pKa = 10.0IDD25 pKa = 3.57PGSFYY30 pKa = 11.31VGFGFGATALSVLIYY45 pKa = 10.73VDD47 pKa = 4.22GVWVSEE53 pKa = 4.11RR54 pKa = 11.84TAWIPDD60 pKa = 3.61PKK62 pKa = 10.43EE63 pKa = 3.61ISPP66 pKa = 4.12
Molecular weight: 7.18 kDa
Isoelectric point according different methods:
Protein with the highest isoelectric point:
>tr|A0A0U4VUF6|A0A0U4VUF6_BPK22 Uncharacterized protein OS=Pseudomonas phage KPP22 OX=1772250 PE=4 SV=1
MM1 pKa = 7.12YY2 pKa = 7.79RR3 pKa = 11.84TPSSKK8 pKa = 9.39FTFICNGLAQNAEE21 pKa = 4.2VTVLLRR27 pKa = 11.84KK28 pKa = 9.38QKK30 pKa = 10.78PEE32 pKa = 4.08DD33 pKa = 3.2VWVVDD38 pKa = 4.13KK39 pKa = 11.43APAANLIRR47 pKa = 11.84IHH49 pKa = 6.12EE50 pKa = 4.34RR51 pKa = 11.84SNPRR55 pKa = 11.84RR56 pKa = 11.84RR57 pKa = 11.84RR58 pKa = 11.84TISILDD64 pKa = 3.44VDD66 pKa = 4.59AVSILHH72 pKa = 6.23KK73 pKa = 10.57RR74 pKa = 3.43
MM1 pKa = 7.12YY2 pKa = 7.79RR3 pKa = 11.84TPSSKK8 pKa = 9.39FTFICNGLAQNAEE21 pKa = 4.2VTVLLRR27 pKa = 11.84KK28 pKa = 9.38QKK30 pKa = 10.78PEE32 pKa = 4.08DD33 pKa = 3.2VWVVDD38 pKa = 4.13KK39 pKa = 11.43APAANLIRR47 pKa = 11.84IHH49 pKa = 6.12EE50 pKa = 4.34RR51 pKa = 11.84SNPRR55 pKa = 11.84RR56 pKa = 11.84RR57 pKa = 11.84RR58 pKa = 11.84TISILDD64 pKa = 3.44VDD66 pKa = 4.59AVSILHH72 pKa = 6.23KK73 pKa = 10.57RR74 pKa = 3.43
Molecular weight: 8.54 kDa
Isoelectric point according different methods:
Peptides (in silico digests for buttom-up proteomics)
Below you can find in silico digests of the whole proteome with Trypsin, Chymotrypsin, Trypsin+LysC, LysN, ArgC proteases suitable for different mass spec machines.| Try ESI |
 |
|---|
| ChTry ESI |
|
|---|
| ArgC ESI |
|
|---|
| LysN ESI |
|
|---|
| TryLysC ESI |
|
|---|
| Try MALDI |
|
|---|
| ChTry MALDI |
|
|---|
| ArgC MALDI |
|
|---|
| LysN MALDI |
|
|---|
| TryLysC MALDI |
|
|---|
| Try LTQ |
|
|---|
| ChTry LTQ |
|
|---|
| ArgC LTQ |
|
|---|
| LysN LTQ |
|
|---|
| TryLysC LTQ |
|
|---|
| Try MSlow |
|
|---|
| ChTry MSlow |
|
|---|
| ArgC MSlow |
|
|---|
| LysN MSlow |
|
|---|
| TryLysC MSlow |
|
|---|
| Try MShigh |
|
|---|
| ChTry MShigh |
|
|---|
| ArgC MShigh |
|
|---|
| LysN MShigh |
|
|---|
| TryLysC MShigh |
|
|---|
General Statistics
Number of major isoforms |
Number of additional isoforms |
Number of all proteins |
Number of amino acids |
Min. Seq. Length |
Max. Seq. Length |
Avg. Seq. Length |
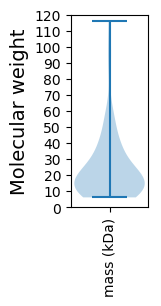
Avg. Mol. Weight |
|---|---|---|---|---|---|---|---|
0 |
19485 |
53 |
1035 |
226.6 |
25.14 |
Amino acid frequency
Ala |
Cys |
Asp |
Glu |
Phe |
Gly |
His |
Ile |
Lys |
Leu |
|---|---|---|---|---|---|---|---|---|---|
10.162 ± 0.31 | 0.939 ± 0.101 |
6.297 ± 0.215 | 7.036 ± 0.406 |
4.008 ± 0.187 | 7.303 ± 0.271 |
1.776 ± 0.166 | 6.025 ± 0.198 |
5.491 ± 0.378 | 7.375 ± 0.221 |
Met |
Asn |
Gln |
Pro |
Arg |
Ser |
Thr |
Val |
Trp |
Tyr |
|---|---|---|---|---|---|---|---|---|---|
2.458 ± 0.111 | 4.265 ± 0.35 |
4.578 ± 0.219 | 3.803 ± 0.153 |
6.076 ± 0.26 | 6.22 ± 0.205 |
5.158 ± 0.221 | 6.574 ± 0.252 |
1.545 ± 0.135 | 2.91 ± 0.101 |
Most of the basic statistics you can see at this page can be downloaded from this CSV file
See this proteome in:

Proteome-pI is available under Creative Commons Attribution-NoDerivs license, for more details see here
| Reference: Kozlowski LP. Proteome-pI 2.0: Proteome Isoelectric Point Database Update. Nucleic Acids Res. 2021, doi: 10.1093/nar/gkab944 | Contact: Lukasz P. Kozlowski |