Kushneria marisflavi
Taxonomy: cellular organisms; Bacteria; Proteobacteria; Gammaproteobacteria; Oceanospirillales; Halomonadaceae; Kushneria
Average proteome isoelectric point is 6.13
Get precalculated fractions of proteins
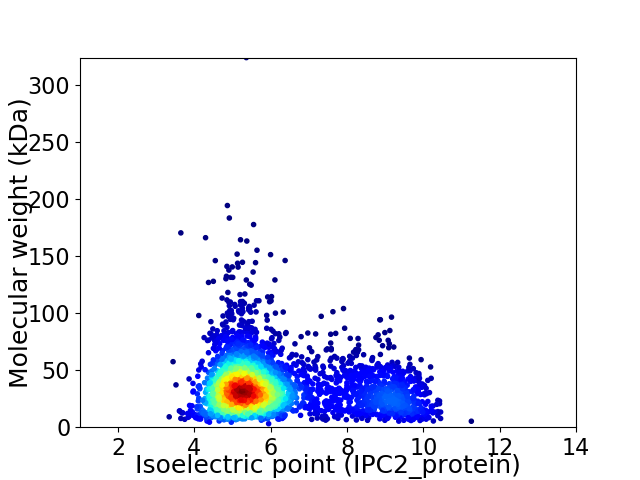
Virtual 2D-PAGE plot for 3205 proteins (isoelectric point calculated using IPC2_protein)
Get csv file with sequences according to given criteria:
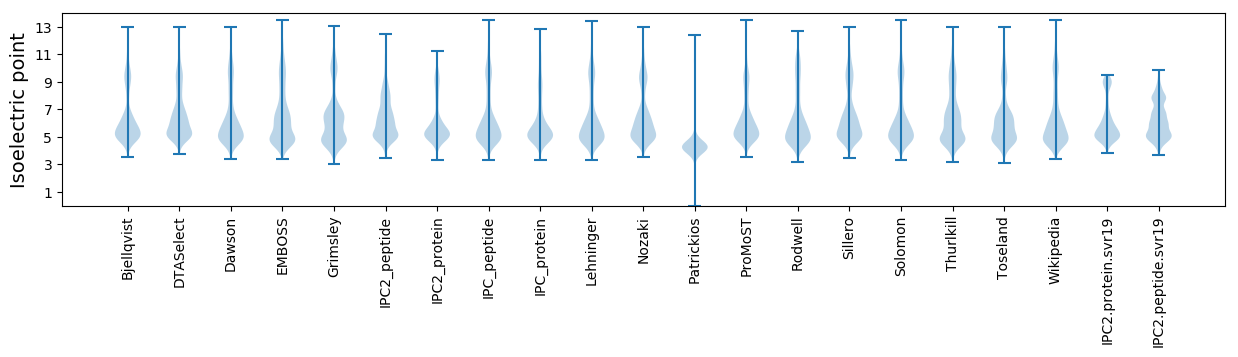
* You can choose from 21 different methods for calculating isoelectric point
Summary statistics related to proteome-wise predictions
Protein with the lowest isoelectric point:
>tr|A0A240UKN6|A0A240UKN6_9GAMM Dehydrogenase OS=Kushneria marisflavi OX=157779 GN=B9H00_02255 PE=4 SV=1
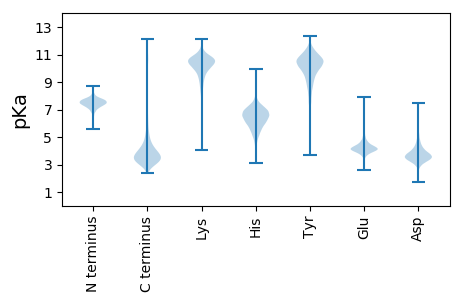
MM1 pKa = 8.1NMMMSSRR8 pKa = 11.84VDD10 pKa = 3.43ADD12 pKa = 3.33QTPCMAMSEE21 pKa = 4.69PPVQPPDD28 pKa = 4.23PEE30 pKa = 4.11PHH32 pKa = 6.56SPPEE36 pKa = 4.08QPPQPQEE43 pKa = 3.92PPIEE47 pKa = 4.36EE48 pKa = 4.54PPMEE52 pKa = 4.9EE53 pKa = 5.31PPLQDD58 pKa = 4.48PPPSQPPPEE67 pKa = 4.42VPPEE71 pKa = 4.03QTPHH75 pKa = 5.29YY76 pKa = 10.16QSS78 pKa = 3.46
MM1 pKa = 8.1NMMMSSRR8 pKa = 11.84VDD10 pKa = 3.43ADD12 pKa = 3.33QTPCMAMSEE21 pKa = 4.69PPVQPPDD28 pKa = 4.23PEE30 pKa = 4.11PHH32 pKa = 6.56SPPEE36 pKa = 4.08QPPQPQEE43 pKa = 3.92PPIEE47 pKa = 4.36EE48 pKa = 4.54PPMEE52 pKa = 4.9EE53 pKa = 5.31PPLQDD58 pKa = 4.48PPPSQPPPEE67 pKa = 4.42VPPEE71 pKa = 4.03QTPHH75 pKa = 5.29YY76 pKa = 10.16QSS78 pKa = 3.46
Molecular weight: 8.66 kDa
Isoelectric point according different methods:
Protein with the highest isoelectric point:
>tr|A0A240UJL9|A0A240UJL9_9GAMM NAD(P)H:quinone oxidoreductase type IV OS=Kushneria marisflavi OX=157779 GN=B9H00_00315 PE=3 SV=1
MM1 pKa = 7.45KK2 pKa = 9.51RR3 pKa = 11.84TFQPSVLKK11 pKa = 10.46RR12 pKa = 11.84KK13 pKa = 9.37RR14 pKa = 11.84NHH16 pKa = 5.37GFRR19 pKa = 11.84ARR21 pKa = 11.84MATKK25 pKa = 10.32NGRR28 pKa = 11.84QVISRR33 pKa = 11.84RR34 pKa = 11.84RR35 pKa = 11.84AKK37 pKa = 9.97GRR39 pKa = 11.84KK40 pKa = 8.85RR41 pKa = 11.84LSAA44 pKa = 3.96
MM1 pKa = 7.45KK2 pKa = 9.51RR3 pKa = 11.84TFQPSVLKK11 pKa = 10.46RR12 pKa = 11.84KK13 pKa = 9.37RR14 pKa = 11.84NHH16 pKa = 5.37GFRR19 pKa = 11.84ARR21 pKa = 11.84MATKK25 pKa = 10.32NGRR28 pKa = 11.84QVISRR33 pKa = 11.84RR34 pKa = 11.84RR35 pKa = 11.84AKK37 pKa = 9.97GRR39 pKa = 11.84KK40 pKa = 8.85RR41 pKa = 11.84LSAA44 pKa = 3.96
Molecular weight: 5.24 kDa
Isoelectric point according different methods:
Peptides (in silico digests for buttom-up proteomics)
Below you can find in silico digests of the whole proteome with Trypsin, Chymotrypsin, Trypsin+LysC, LysN, ArgC proteases suitable for different mass spec machines.| Try ESI |
 |
|---|
| ChTry ESI |
|
|---|
| ArgC ESI |
|
|---|
| LysN ESI |
|
|---|
| TryLysC ESI |
|
|---|
| Try MALDI |
|
|---|
| ChTry MALDI |
|
|---|
| ArgC MALDI |
|
|---|
| LysN MALDI |
|
|---|
| TryLysC MALDI |
|
|---|
| Try LTQ |
|
|---|
| ChTry LTQ |
|
|---|
| ArgC LTQ |
|
|---|
| LysN LTQ |
|
|---|
| TryLysC LTQ |
|
|---|
| Try MSlow |
|
|---|
| ChTry MSlow |
|
|---|
| ArgC MSlow |
|
|---|
| LysN MSlow |
|
|---|
| TryLysC MSlow |
|
|---|
| Try MShigh |
|
|---|
| ChTry MShigh |
|
|---|
| ArgC MShigh |
|
|---|
| LysN MShigh |
|
|---|
| TryLysC MShigh |
|
|---|
General Statistics
Number of major isoforms |
Number of additional isoforms |
Number of all proteins |
Number of amino acids |
Min. Seq. Length |
Max. Seq. Length |
Avg. Seq. Length |
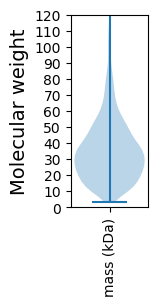
Avg. Mol. Weight |
|---|---|---|---|---|---|---|---|
0 |
1071555 |
26 |
2911 |
334.3 |
36.81 |
Amino acid frequency
Ala |
Cys |
Asp |
Glu |
Phe |
Gly |
His |
Ile |
Lys |
Leu |
|---|---|---|---|---|---|---|---|---|---|
10.446 ± 0.046 | 0.964 ± 0.014 |
5.9 ± 0.035 | 6.046 ± 0.044 |
3.506 ± 0.03 | 8.072 ± 0.042 |
2.655 ± 0.025 | 5.178 ± 0.033 |
2.556 ± 0.035 | 11.019 ± 0.059 |
Met |
Asn |
Gln |
Pro |
Arg |
Ser |
Thr |
Val |
Trp |
Tyr |
|---|---|---|---|---|---|---|---|---|---|
2.844 ± 0.021 | 2.8 ± 0.03 |
4.691 ± 0.029 | 4.068 ± 0.03 |
7.24 ± 0.047 | 5.944 ± 0.032 |
5.27 ± 0.028 | 6.964 ± 0.034 |
1.481 ± 0.022 | 2.354 ± 0.021 |
Most of the basic statistics you can see at this page can be downloaded from this CSV file
See this proteome in:

Proteome-pI is available under Creative Commons Attribution-NoDerivs license, for more details see here
| Reference: Kozlowski LP. Proteome-pI 2.0: Proteome Isoelectric Point Database Update. Nucleic Acids Res. 2021, doi: 10.1093/nar/gkab944 | Contact: Lukasz P. Kozlowski |