Rothia phage Spartoi
Taxonomy: Viruses; Duplodnaviria; Heunggongvirae; Uroviricota; Caudoviricetes; Caudovirales; Siphoviridae; unclassified Siphoviridae
Average proteome isoelectric point is 6.76
Get precalculated fractions of proteins
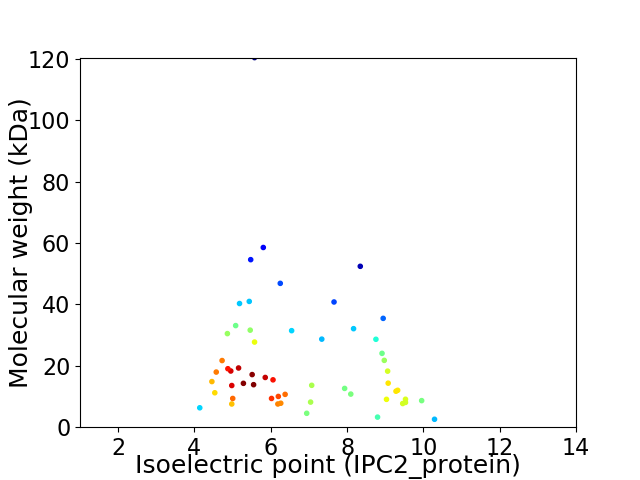
Virtual 2D-PAGE plot for 56 proteins (isoelectric point calculated using IPC2_protein)
Get csv file with sequences according to given criteria:
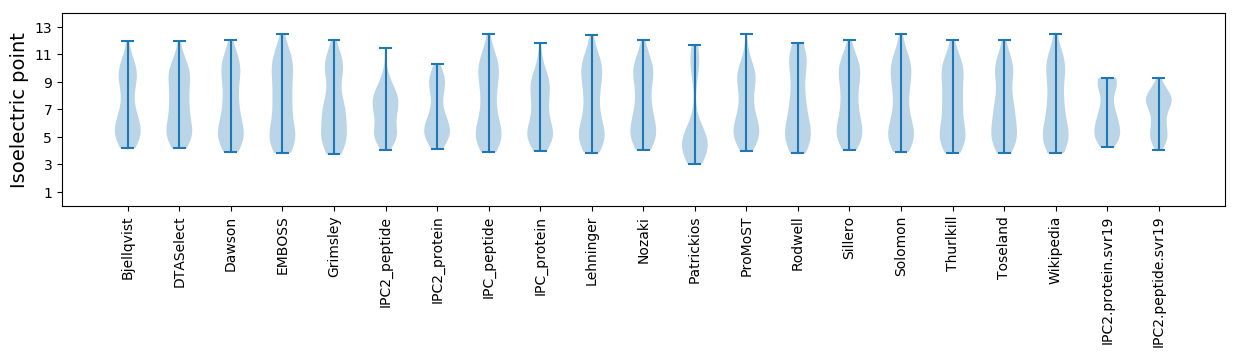
* You can choose from 21 different methods for calculating isoelectric point
Summary statistics related to proteome-wise predictions
Protein with the lowest isoelectric point:
>tr|A0A5K7NMS2|A0A5K7NMS2_9CAUD Uncharacterized protein OS=Rothia phage Spartoi OX=2483661 GN=29 PE=4 SV=1
MM1 pKa = 7.72EE2 pKa = 5.1LTLQQLQAKK11 pKa = 8.93CIYY14 pKa = 10.02LAEE17 pKa = 4.39EE18 pKa = 3.81NAQLRR23 pKa = 11.84DD24 pKa = 3.53ALLDD28 pKa = 3.76AKK30 pKa = 10.67LQLGVIALDD39 pKa = 3.72NQEE42 pKa = 4.11PQANSGEE49 pKa = 4.44TSEE52 pKa = 4.46EE53 pKa = 4.12THH55 pKa = 6.77NDD57 pKa = 2.97
MM1 pKa = 7.72EE2 pKa = 5.1LTLQQLQAKK11 pKa = 8.93CIYY14 pKa = 10.02LAEE17 pKa = 4.39EE18 pKa = 3.81NAQLRR23 pKa = 11.84DD24 pKa = 3.53ALLDD28 pKa = 3.76AKK30 pKa = 10.67LQLGVIALDD39 pKa = 3.72NQEE42 pKa = 4.11PQANSGEE49 pKa = 4.44TSEE52 pKa = 4.46EE53 pKa = 4.12THH55 pKa = 6.77NDD57 pKa = 2.97
Molecular weight: 6.33 kDa
Isoelectric point according different methods:
Protein with the highest isoelectric point:
>tr|A0A5K7NMH8|A0A5K7NMH8_9CAUD Uncharacterized protein OS=Rothia phage Spartoi OX=2483661 GN=9 PE=4 SV=1
MM1 pKa = 7.81PSVQSLRR8 pKa = 11.84GKK10 pKa = 10.06AVVRR14 pKa = 11.84HH15 pKa = 5.89GPPPNLRR22 pKa = 11.84GGGRR26 pKa = 11.84NSGGGNDD33 pKa = 4.39APLGVPPIRR42 pKa = 11.84GAGSFVLSPAPLAIPPADD60 pKa = 3.36RR61 pKa = 11.84SKK63 pKa = 11.07EE64 pKa = 3.89HH65 pKa = 5.95WQHH68 pKa = 7.07LEE70 pKa = 3.78QEE72 pKa = 4.41PQSGKK77 pKa = 9.81PP78 pKa = 3.24
MM1 pKa = 7.81PSVQSLRR8 pKa = 11.84GKK10 pKa = 10.06AVVRR14 pKa = 11.84HH15 pKa = 5.89GPPPNLRR22 pKa = 11.84GGGRR26 pKa = 11.84NSGGGNDD33 pKa = 4.39APLGVPPIRR42 pKa = 11.84GAGSFVLSPAPLAIPPADD60 pKa = 3.36RR61 pKa = 11.84SKK63 pKa = 11.07EE64 pKa = 3.89HH65 pKa = 5.95WQHH68 pKa = 7.07LEE70 pKa = 3.78QEE72 pKa = 4.41PQSGKK77 pKa = 9.81PP78 pKa = 3.24
Molecular weight: 8.07 kDa
Isoelectric point according different methods:
Peptides (in silico digests for buttom-up proteomics)
Below you can find in silico digests of the whole proteome with Trypsin, Chymotrypsin, Trypsin+LysC, LysN, ArgC proteases suitable for different mass spec machines.| Try ESI |
 |
|---|
| ChTry ESI |
|
|---|
| ArgC ESI |
|
|---|
| LysN ESI |
|
|---|
| TryLysC ESI |
|
|---|
| Try MALDI |
|
|---|
| ChTry MALDI |
|
|---|
| ArgC MALDI |
|
|---|
| LysN MALDI |
|
|---|
| TryLysC MALDI |
|
|---|
| Try LTQ |
|
|---|
| ChTry LTQ |
|
|---|
| ArgC LTQ |
|
|---|
| LysN LTQ |
|
|---|
| TryLysC LTQ |
|
|---|
| Try MSlow |
|
|---|
| ChTry MSlow |
|
|---|
| ArgC MSlow |
|
|---|
| LysN MSlow |
|
|---|
| TryLysC MSlow |
|
|---|
| Try MShigh |
|
|---|
| ChTry MShigh |
|
|---|
| ArgC MShigh |
|
|---|
| LysN MShigh |
|
|---|
| TryLysC MShigh |
|
|---|
General Statistics
Number of major isoforms |
Number of additional isoforms |
Number of all proteins |
Number of amino acids |
Min. Seq. Length |
Max. Seq. Length |
Avg. Seq. Length |
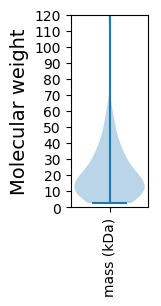
Avg. Mol. Weight |
|---|---|---|---|---|---|---|---|
0 |
11117 |
25 |
1174 |
198.5 |
21.72 |
Amino acid frequency
Ala |
Cys |
Asp |
Glu |
Phe |
Gly |
His |
Ile |
Lys |
Leu |
|---|---|---|---|---|---|---|---|---|---|
11.127 ± 0.556 | 0.774 ± 0.138 |
4.821 ± 0.245 | 7.097 ± 0.409 |
3.292 ± 0.237 | 8.15 ± 0.42 |
1.781 ± 0.157 | 6.099 ± 0.357 |
5.991 ± 0.338 | 7.781 ± 0.339 |
Met |
Asn |
Gln |
Pro |
Arg |
Ser |
Thr |
Val |
Trp |
Tyr |
|---|---|---|---|---|---|---|---|---|---|
2.258 ± 0.136 | 3.868 ± 0.202 |
5.118 ± 0.236 | 3.823 ± 0.225 |
5.604 ± 0.426 | 5.784 ± 0.297 |
6.009 ± 0.312 | 6.629 ± 0.313 |
1.727 ± 0.15 | 2.267 ± 0.244 |
Most of the basic statistics you can see at this page can be downloaded from this CSV file
See this proteome in:

Proteome-pI is available under Creative Commons Attribution-NoDerivs license, for more details see here
| Reference: Kozlowski LP. Proteome-pI 2.0: Proteome Isoelectric Point Database Update. Nucleic Acids Res. 2021, doi: 10.1093/nar/gkab944 | Contact: Lukasz P. Kozlowski |