Alfalfa virus S
Taxonomy: Viruses; Riboviria; Orthornavirae; Kitrinoviricota; Alsuviricetes; Tymovirales; Alphaflexiviridae; Allexivirus
Average proteome isoelectric point is 6.72
Get precalculated fractions of proteins
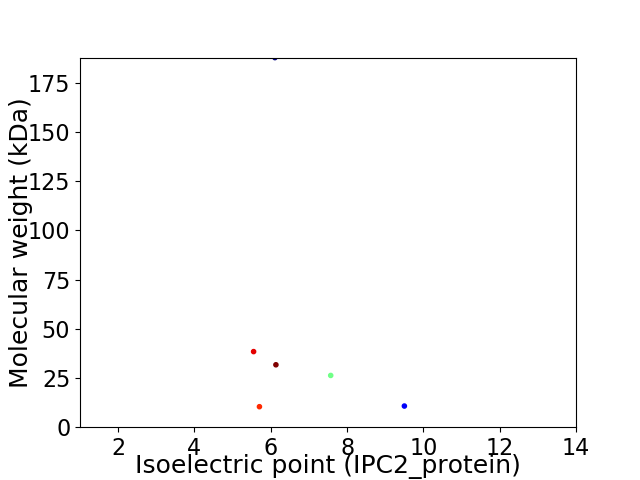
Virtual 2D-PAGE plot for 6 proteins (isoelectric point calculated using IPC2_protein)
Get csv file with sequences according to given criteria:
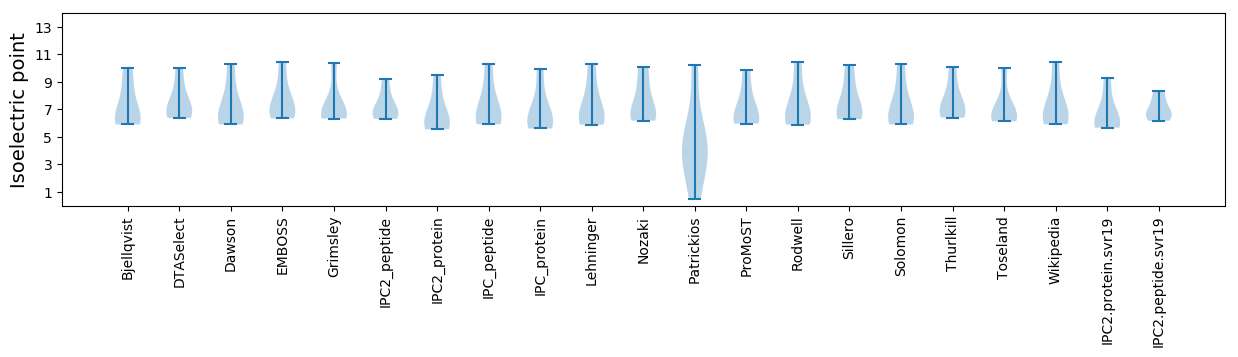
* You can choose from 21 different methods for calculating isoelectric point
Summary statistics related to proteome-wise predictions
Protein with the lowest isoelectric point:
>tr|A0A1X9PY60|A0A1X9PY60_9VIRU CP OS=Alfalfa virus S OX=1985968 PE=4 SV=1
MM1 pKa = 7.04QAPEE5 pKa = 4.45LVHH8 pKa = 5.77THH10 pKa = 6.91ASTSCQQSPWYY21 pKa = 9.57SSPWALLLVSGLSALLVLAAANYY44 pKa = 8.73FNSLPGSHH52 pKa = 6.55SCLLTITGHH61 pKa = 5.2SVSVSGCEE69 pKa = 3.93NHH71 pKa = 7.13DD72 pKa = 3.49VPAIIQSFAWSGHH85 pKa = 4.1AFNRR89 pKa = 11.84QLPGVIHH96 pKa = 7.05SDD98 pKa = 3.1
MM1 pKa = 7.04QAPEE5 pKa = 4.45LVHH8 pKa = 5.77THH10 pKa = 6.91ASTSCQQSPWYY21 pKa = 9.57SSPWALLLVSGLSALLVLAAANYY44 pKa = 8.73FNSLPGSHH52 pKa = 6.55SCLLTITGHH61 pKa = 5.2SVSVSGCEE69 pKa = 3.93NHH71 pKa = 7.13DD72 pKa = 3.49VPAIIQSFAWSGHH85 pKa = 4.1AFNRR89 pKa = 11.84QLPGVIHH96 pKa = 7.05SDD98 pKa = 3.1
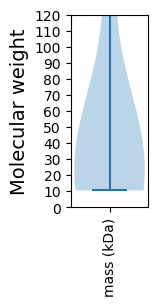
Molecular weight: 10.42 kDa
Isoelectric point according different methods:
Protein with the highest isoelectric point:
>tr|A0A1X9PY58|A0A1X9PY58_9VIRU Movement protein TGBp3 OS=Alfalfa virus S OX=1985968 PE=3 SV=1
MM1 pKa = 7.4SFAPPPDD8 pKa = 3.5YY9 pKa = 11.21TKK11 pKa = 11.02VFLAATIGAALALTTLFATRR31 pKa = 11.84NTAPHH36 pKa = 6.03VGDD39 pKa = 4.8NIHH42 pKa = 6.57HH43 pKa = 6.79LPHH46 pKa = 6.7GGLYY50 pKa = 9.86QDD52 pKa = 3.5GNKK55 pKa = 9.9RR56 pKa = 11.84IAYY59 pKa = 8.27AGPGTGAHH67 pKa = 6.57PRR69 pKa = 11.84QHH71 pKa = 6.95FLPAIAVVLLTLGIIISEE89 pKa = 4.11RR90 pKa = 11.84FKK92 pKa = 11.14RR93 pKa = 11.84PTRR96 pKa = 11.84SCRR99 pKa = 11.84CC100 pKa = 3.32
MM1 pKa = 7.4SFAPPPDD8 pKa = 3.5YY9 pKa = 11.21TKK11 pKa = 11.02VFLAATIGAALALTTLFATRR31 pKa = 11.84NTAPHH36 pKa = 6.03VGDD39 pKa = 4.8NIHH42 pKa = 6.57HH43 pKa = 6.79LPHH46 pKa = 6.7GGLYY50 pKa = 9.86QDD52 pKa = 3.5GNKK55 pKa = 9.9RR56 pKa = 11.84IAYY59 pKa = 8.27AGPGTGAHH67 pKa = 6.57PRR69 pKa = 11.84QHH71 pKa = 6.95FLPAIAVVLLTLGIIISEE89 pKa = 4.11RR90 pKa = 11.84FKK92 pKa = 11.14RR93 pKa = 11.84PTRR96 pKa = 11.84SCRR99 pKa = 11.84CC100 pKa = 3.32
Molecular weight: 10.76 kDa
Isoelectric point according different methods:
Peptides (in silico digests for buttom-up proteomics)
Below you can find in silico digests of the whole proteome with Trypsin, Chymotrypsin, Trypsin+LysC, LysN, ArgC proteases suitable for different mass spec machines.| Try ESI |
 |
|---|
| ChTry ESI |
|
|---|
| ArgC ESI |
|
|---|
| LysN ESI |
|
|---|
| TryLysC ESI |
|
|---|
| Try MALDI |
|
|---|
| ChTry MALDI |
|
|---|
| ArgC MALDI |
|
|---|
| LysN MALDI |
|
|---|
| TryLysC MALDI |
|
|---|
| Try LTQ |
|
|---|
| ChTry LTQ |
|
|---|
| ArgC LTQ |
|
|---|
| LysN LTQ |
|
|---|
| TryLysC LTQ |
|
|---|
| Try MSlow |
|
|---|
| ChTry MSlow |
|
|---|
| ArgC MSlow |
|
|---|
| LysN MSlow |
|
|---|
| TryLysC MSlow |
|
|---|
| Try MShigh |
|
|---|
| ChTry MShigh |
|
|---|
| ArgC MShigh |
|
|---|
| LysN MShigh |
|
|---|
| TryLysC MShigh |
|
|---|
General Statistics
Number of major isoforms |
Number of additional isoforms |
Number of all proteins |
Number of amino acids |
Min. Seq. Length |
Max. Seq. Length |
Avg. Seq. Length |
Avg. Mol. Weight |
|---|---|---|---|---|---|---|---|
0 |
2722 |
98 |
1657 |
453.7 |
50.92 |
Amino acid frequency
Ala |
Cys |
Asp |
Glu |
Phe |
Gly |
His |
Ile |
Lys |
Leu |
|---|---|---|---|---|---|---|---|---|---|
8.56 ± 0.541 | 1.763 ± 0.232 |
5.253 ± 1.043 | 5.547 ± 0.774 |
4.225 ± 0.337 | 4.482 ± 0.576 |
3.674 ± 0.61 | 4.923 ± 0.57 |
4.592 ± 1.266 | 10.029 ± 0.736 |
Met |
Asn |
Gln |
Pro |
Arg |
Ser |
Thr |
Val |
Trp |
Tyr |
|---|---|---|---|---|---|---|---|---|---|
1.874 ± 0.496 | 4.482 ± 0.707 |
6.392 ± 0.477 | 5.29 ± 0.492 |
5.547 ± 0.455 | 6.613 ± 1.414 |
7.788 ± 0.726 | 4.96 ± 0.259 |
0.735 ± 0.219 | 3.27 ± 0.585 |
Most of the basic statistics you can see at this page can be downloaded from this CSV file
See this proteome in:

Proteome-pI is available under Creative Commons Attribution-NoDerivs license, for more details see here
| Reference: Kozlowski LP. Proteome-pI 2.0: Proteome Isoelectric Point Database Update. Nucleic Acids Res. 2021, doi: 10.1093/nar/gkab944 | Contact: Lukasz P. Kozlowski |