Candidatus Erwinia haradaeae
Taxonomy: cellular organisms; Bacteria; Proteobacteria; Gammaproteobacteria; Enterobacterales; Erwiniaceae; Erwinia
Average proteome isoelectric point is 7.52
Get precalculated fractions of proteins
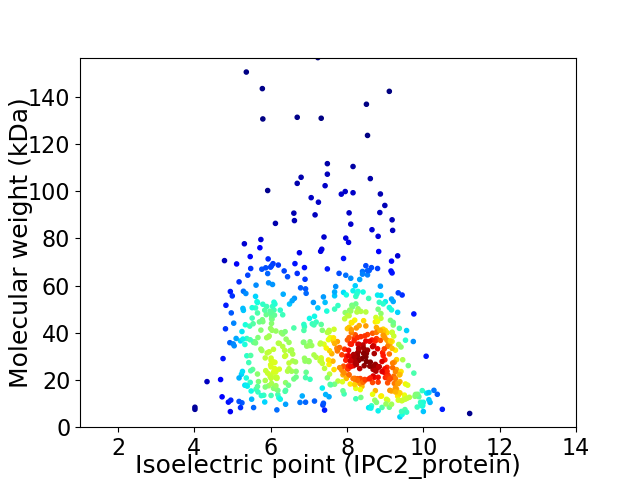
Virtual 2D-PAGE plot for 630 proteins (isoelectric point calculated using IPC2_protein)
Get csv file with sequences according to given criteria:
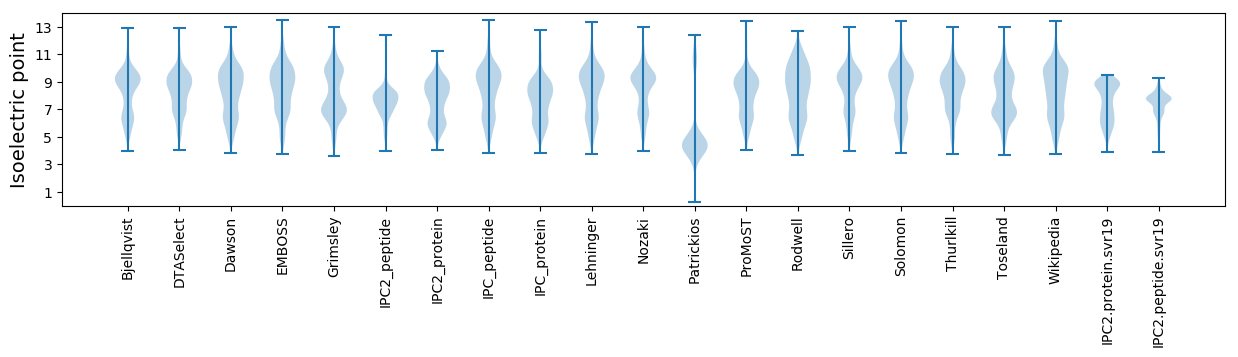
* You can choose from 21 different methods for calculating isoelectric point
Summary statistics related to proteome-wise predictions
Protein with the lowest isoelectric point:
>tr|A0A451DPX6|A0A451DPX6_9GAMM 2-iminoacetate synthase OS=Candidatus Erwinia haradaeae OX=1922217 GN=thiH PE=4 SV=1
MM1 pKa = 7.85KK2 pKa = 9.36ITFNNRR8 pKa = 11.84SLEE11 pKa = 4.03LEE13 pKa = 4.2NPLSITNFLTDD24 pKa = 2.86QCYY27 pKa = 10.48EE28 pKa = 4.18SGPGIALSLNQNVIPHH44 pKa = 6.0QYY46 pKa = 8.79WPDD49 pKa = 3.47YY50 pKa = 9.97YY51 pKa = 10.44INDD54 pKa = 3.91GDD56 pKa = 5.91DD57 pKa = 3.16ILLFQAIAGGG67 pKa = 3.54
MM1 pKa = 7.85KK2 pKa = 9.36ITFNNRR8 pKa = 11.84SLEE11 pKa = 4.03LEE13 pKa = 4.2NPLSITNFLTDD24 pKa = 2.86QCYY27 pKa = 10.48EE28 pKa = 4.18SGPGIALSLNQNVIPHH44 pKa = 6.0QYY46 pKa = 8.79WPDD49 pKa = 3.47YY50 pKa = 9.97YY51 pKa = 10.44INDD54 pKa = 3.91GDD56 pKa = 5.91DD57 pKa = 3.16ILLFQAIAGGG67 pKa = 3.54
Molecular weight: 7.56 kDa
Isoelectric point according different methods:
Protein with the highest isoelectric point:
>tr|A0A451DIZ9|A0A451DIZ9_9GAMM Aminotransferase OS=Candidatus Erwinia haradaeae OX=1922217 GN=aspC PE=3 SV=1
MM1 pKa = 7.45KK2 pKa = 9.51RR3 pKa = 11.84TFQPSVIKK11 pKa = 10.58RR12 pKa = 11.84NRR14 pKa = 11.84THH16 pKa = 7.31GFRR19 pKa = 11.84ARR21 pKa = 11.84MKK23 pKa = 10.13SKK25 pKa = 10.5NGRR28 pKa = 11.84KK29 pKa = 9.04ILSHH33 pKa = 6.45RR34 pKa = 11.84RR35 pKa = 11.84AKK37 pKa = 10.6GRR39 pKa = 11.84VRR41 pKa = 11.84LTVSSNKK48 pKa = 9.58HH49 pKa = 4.31
MM1 pKa = 7.45KK2 pKa = 9.51RR3 pKa = 11.84TFQPSVIKK11 pKa = 10.58RR12 pKa = 11.84NRR14 pKa = 11.84THH16 pKa = 7.31GFRR19 pKa = 11.84ARR21 pKa = 11.84MKK23 pKa = 10.13SKK25 pKa = 10.5NGRR28 pKa = 11.84KK29 pKa = 9.04ILSHH33 pKa = 6.45RR34 pKa = 11.84RR35 pKa = 11.84AKK37 pKa = 10.6GRR39 pKa = 11.84VRR41 pKa = 11.84LTVSSNKK48 pKa = 9.58HH49 pKa = 4.31
Molecular weight: 5.81 kDa
Isoelectric point according different methods:
Peptides (in silico digests for buttom-up proteomics)
Below you can find in silico digests of the whole proteome with Trypsin, Chymotrypsin, Trypsin+LysC, LysN, ArgC proteases suitable for different mass spec machines.| Try ESI |
 |
|---|
| ChTry ESI |
|
|---|
| ArgC ESI |
|
|---|
| LysN ESI |
|
|---|
| TryLysC ESI |
|
|---|
| Try MALDI |
|
|---|
| ChTry MALDI |
|
|---|
| ArgC MALDI |
|
|---|
| LysN MALDI |
|
|---|
| TryLysC MALDI |
|
|---|
| Try LTQ |
|
|---|
| ChTry LTQ |
|
|---|
| ArgC LTQ |
|
|---|
| LysN LTQ |
|
|---|
| TryLysC LTQ |
|
|---|
| Try MSlow |
|
|---|
| ChTry MSlow |
|
|---|
| ArgC MSlow |
|
|---|
| LysN MSlow |
|
|---|
| TryLysC MSlow |
|
|---|
| Try MShigh |
|
|---|
| ChTry MShigh |
|
|---|
| ArgC MShigh |
|
|---|
| LysN MShigh |
|
|---|
| TryLysC MShigh |
|
|---|
General Statistics
Number of major isoforms |
Number of additional isoforms |
Number of all proteins |
Number of amino acids |
Min. Seq. Length |
Max. Seq. Length |
Avg. Seq. Length |
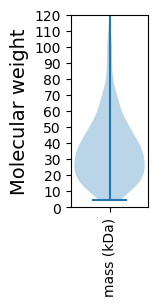
Avg. Mol. Weight |
|---|---|---|---|---|---|---|---|
0 |
211832 |
38 |
1408 |
336.2 |
37.76 |
Amino acid frequency
Ala |
Cys |
Asp |
Glu |
Phe |
Gly |
His |
Ile |
Lys |
Leu |
|---|---|---|---|---|---|---|---|---|---|
6.893 ± 0.071 | 1.435 ± 0.035 |
4.714 ± 0.058 | 4.973 ± 0.088 |
3.787 ± 0.057 | 6.552 ± 0.075 |
2.917 ± 0.043 | 8.847 ± 0.084 |
5.555 ± 0.069 | 10.596 ± 0.1 |
Met |
Asn |
Gln |
Pro |
Arg |
Ser |
Thr |
Val |
Trp |
Tyr |
|---|---|---|---|---|---|---|---|---|---|
2.703 ± 0.035 | 4.758 ± 0.054 |
3.716 ± 0.043 | 4.22 ± 0.052 |
5.402 ± 0.077 | 6.811 ± 0.068 |
5.388 ± 0.05 | 6.268 ± 0.077 |
1.159 ± 0.035 | 3.306 ± 0.057 |
Most of the basic statistics you can see at this page can be downloaded from this CSV file
See this proteome in:

Proteome-pI is available under Creative Commons Attribution-NoDerivs license, for more details see here
| Reference: Kozlowski LP. Proteome-pI 2.0: Proteome Isoelectric Point Database Update. Nucleic Acids Res. 2021, doi: 10.1093/nar/gkab944 | Contact: Lukasz P. Kozlowski |