Rhodanobacter sp. B05
Taxonomy: cellular organisms; Bacteria; Proteobacteria; Gammaproteobacteria; Xanthomonadales; Rhodanobacteraceae; Rhodanobacter; unclassified Rhodanobacter
Average proteome isoelectric point is 6.77
Get precalculated fractions of proteins
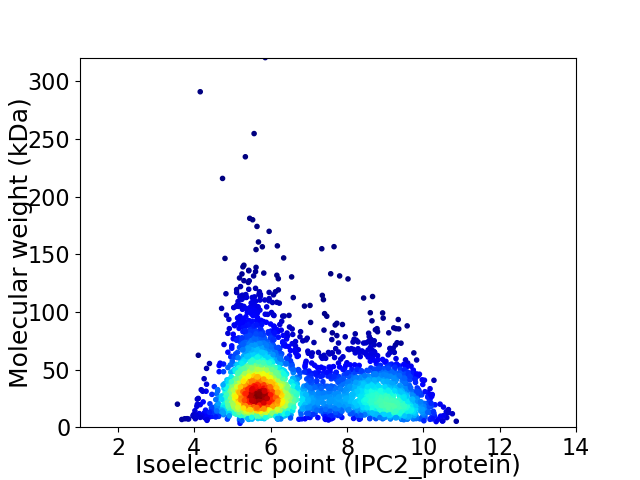
Virtual 2D-PAGE plot for 3234 proteins (isoelectric point calculated using IPC2_protein)
Get csv file with sequences according to given criteria:
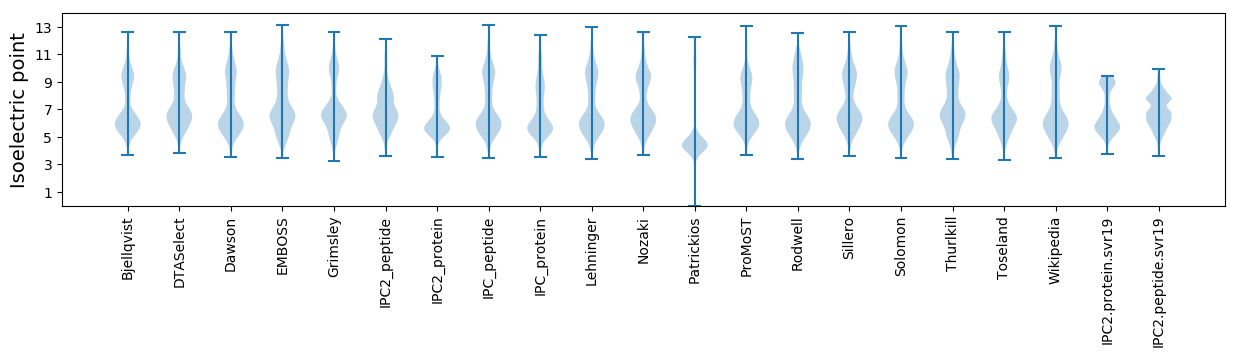
* You can choose from 21 different methods for calculating isoelectric point
Summary statistics related to proteome-wise predictions
Protein with the lowest isoelectric point:
>tr|A0A1V3Q1Z6|A0A1V3Q1Z6_9GAMM ABC transporter permease OS=Rhodanobacter sp. B05 OX=1945859 GN=B0E47_06755 PE=3 SV=1
MM1 pKa = 7.03SQSSPEE7 pKa = 3.85ATVLRR12 pKa = 11.84KK13 pKa = 9.08WMCVVCGYY21 pKa = 10.36IYY23 pKa = 10.71DD24 pKa = 4.09EE25 pKa = 4.5AVGVPDD31 pKa = 3.87EE32 pKa = 5.73DD33 pKa = 3.8IPAGTRR39 pKa = 11.84WEE41 pKa = 4.49DD42 pKa = 3.59VPEE45 pKa = 4.08TWTCPDD51 pKa = 3.96CGTTKK56 pKa = 11.01DD57 pKa = 3.95DD58 pKa = 4.27FEE60 pKa = 5.03MIEE63 pKa = 3.83IDD65 pKa = 3.43
MM1 pKa = 7.03SQSSPEE7 pKa = 3.85ATVLRR12 pKa = 11.84KK13 pKa = 9.08WMCVVCGYY21 pKa = 10.36IYY23 pKa = 10.71DD24 pKa = 4.09EE25 pKa = 4.5AVGVPDD31 pKa = 3.87EE32 pKa = 5.73DD33 pKa = 3.8IPAGTRR39 pKa = 11.84WEE41 pKa = 4.49DD42 pKa = 3.59VPEE45 pKa = 4.08TWTCPDD51 pKa = 3.96CGTTKK56 pKa = 11.01DD57 pKa = 3.95DD58 pKa = 4.27FEE60 pKa = 5.03MIEE63 pKa = 3.83IDD65 pKa = 3.43
Molecular weight: 7.33 kDa
Isoelectric point according different methods:
Protein with the highest isoelectric point:
>tr|A0A1V3Q843|A0A1V3Q843_9GAMM Uncharacterized protein OS=Rhodanobacter sp. B05 OX=1945859 GN=B0E47_03055 PE=4 SV=1
MM1 pKa = 7.45KK2 pKa = 9.59RR3 pKa = 11.84TFQPSKK9 pKa = 10.06LKK11 pKa = 10.38RR12 pKa = 11.84ARR14 pKa = 11.84THH16 pKa = 5.89GFRR19 pKa = 11.84ARR21 pKa = 11.84MATADD26 pKa = 3.12GRR28 pKa = 11.84KK29 pKa = 9.4IINARR34 pKa = 11.84RR35 pKa = 11.84AKK37 pKa = 9.71GRR39 pKa = 11.84KK40 pKa = 8.92RR41 pKa = 11.84LIPP44 pKa = 4.02
MM1 pKa = 7.45KK2 pKa = 9.59RR3 pKa = 11.84TFQPSKK9 pKa = 10.06LKK11 pKa = 10.38RR12 pKa = 11.84ARR14 pKa = 11.84THH16 pKa = 5.89GFRR19 pKa = 11.84ARR21 pKa = 11.84MATADD26 pKa = 3.12GRR28 pKa = 11.84KK29 pKa = 9.4IINARR34 pKa = 11.84RR35 pKa = 11.84AKK37 pKa = 9.71GRR39 pKa = 11.84KK40 pKa = 8.92RR41 pKa = 11.84LIPP44 pKa = 4.02
Molecular weight: 5.15 kDa
Isoelectric point according different methods:
Peptides (in silico digests for buttom-up proteomics)
Below you can find in silico digests of the whole proteome with Trypsin, Chymotrypsin, Trypsin+LysC, LysN, ArgC proteases suitable for different mass spec machines.| Try ESI |
 |
|---|
| ChTry ESI |
|
|---|
| ArgC ESI |
|
|---|
| LysN ESI |
|
|---|
| TryLysC ESI |
|
|---|
| Try MALDI |
|
|---|
| ChTry MALDI |
|
|---|
| ArgC MALDI |
|
|---|
| LysN MALDI |
|
|---|
| TryLysC MALDI |
|
|---|
| Try LTQ |
|
|---|
| ChTry LTQ |
|
|---|
| ArgC LTQ |
|
|---|
| LysN LTQ |
|
|---|
| TryLysC LTQ |
|
|---|
| Try MSlow |
|
|---|
| ChTry MSlow |
|
|---|
| ArgC MSlow |
|
|---|
| LysN MSlow |
|
|---|
| TryLysC MSlow |
|
|---|
| Try MShigh |
|
|---|
| ChTry MShigh |
|
|---|
| ArgC MShigh |
|
|---|
| LysN MShigh |
|
|---|
| TryLysC MShigh |
|
|---|
General Statistics
Number of major isoforms |
Number of additional isoforms |
Number of all proteins |
Number of amino acids |
Min. Seq. Length |
Max. Seq. Length |
Avg. Seq. Length |
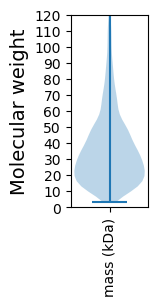
Avg. Mol. Weight |
|---|---|---|---|---|---|---|---|
0 |
1122722 |
30 |
3095 |
347.2 |
37.8 |
Amino acid frequency
Ala |
Cys |
Asp |
Glu |
Phe |
Gly |
His |
Ile |
Lys |
Leu |
|---|---|---|---|---|---|---|---|---|---|
12.514 ± 0.062 | 0.852 ± 0.013 |
5.805 ± 0.036 | 4.868 ± 0.046 |
3.445 ± 0.024 | 8.434 ± 0.04 |
2.599 ± 0.023 | 4.365 ± 0.029 |
2.936 ± 0.036 | 11.013 ± 0.052 |
Met |
Asn |
Gln |
Pro |
Arg |
Ser |
Thr |
Val |
Trp |
Tyr |
|---|---|---|---|---|---|---|---|---|---|
2.243 ± 0.018 | 2.64 ± 0.031 |
5.338 ± 0.031 | 3.948 ± 0.027 |
7.159 ± 0.048 | 5.488 ± 0.032 |
4.943 ± 0.04 | 7.287 ± 0.036 |
1.586 ± 0.018 | 2.536 ± 0.024 |
Most of the basic statistics you can see at this page can be downloaded from this CSV file
See this proteome in:

Proteome-pI is available under Creative Commons Attribution-NoDerivs license, for more details see here
| Reference: Kozlowski LP. Proteome-pI 2.0: Proteome Isoelectric Point Database Update. Nucleic Acids Res. 2021, doi: 10.1093/nar/gkab944 | Contact: Lukasz P. Kozlowski |