Scophthalmus maximus (Turbot) (Psetta maxima)
Taxonomy: cellular organisms; Eukaryota; Opisthokonta; Metazoa; Eumetazoa; Bilateria; Deuterostomia; Chordata; Craniata; Vertebrata; Gnathostomata; Teleostomi; Euteleostomi; Actinopterygii; Actinopteri; Neopterygii; Teleostei; Osteoglossocephalai; Clupeocephala; Euteleosteomorpha; Neoteleostei; E
Average proteome isoelectric point is 6.61
Get precalculated fractions of proteins
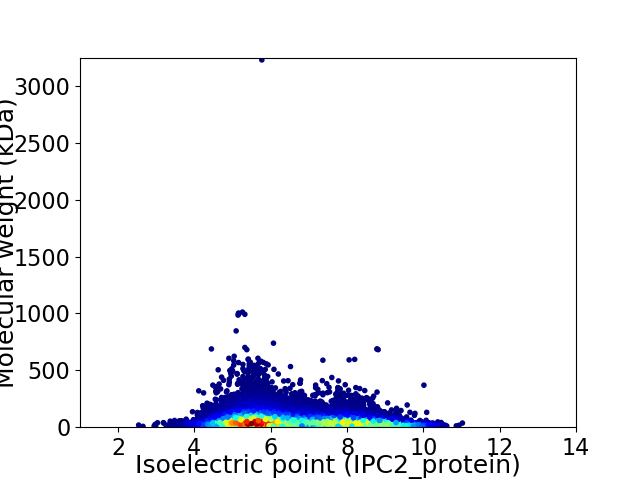
Virtual 2D-PAGE plot for 24929 proteins (isoelectric point calculated using IPC2_protein)
Get csv file with sequences according to given criteria:
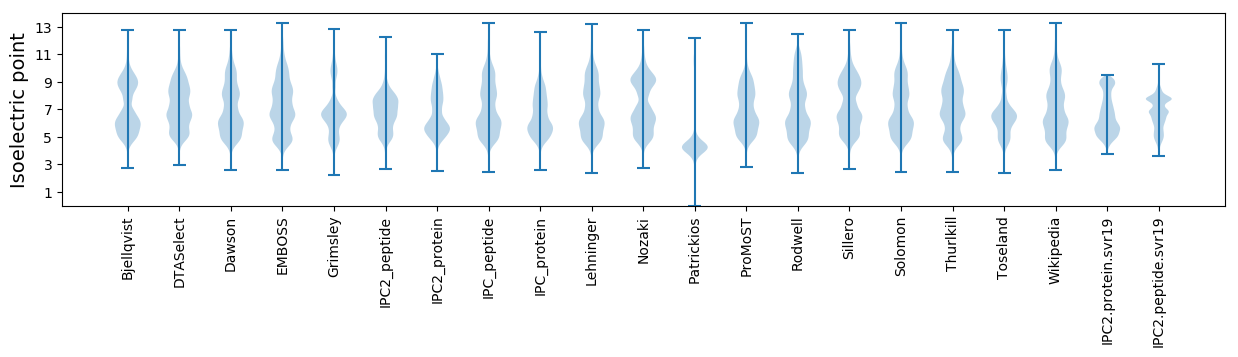
* You can choose from 21 different methods for calculating isoelectric point
Summary statistics related to proteome-wise predictions
Protein with the lowest isoelectric point:
>tr|A0A2U9CXE1|A0A2U9CXE1_SCOMX Putative zinc finger C2HC domain-containing protein 1A OS=Scophthalmus maximus OX=52904 GN=SMAX5B_002010 PE=4 SV=1
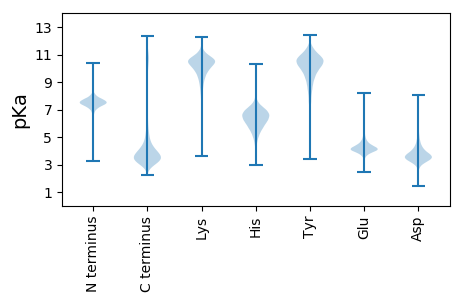
CC1 pKa = 7.78EE2 pKa = 5.95DD3 pKa = 4.11LDD5 pKa = 4.67DD6 pKa = 4.03WTSDD10 pKa = 3.23KK11 pKa = 11.01PPAVCHH17 pKa = 5.41SHH19 pKa = 6.54SLCQDD24 pKa = 3.33EE25 pKa = 5.21PVDD28 pKa = 3.99EE29 pKa = 4.92PVDD32 pKa = 3.93EE33 pKa = 4.85PVDD36 pKa = 4.05DD37 pKa = 4.84PVDD40 pKa = 3.81EE41 pKa = 4.92PVDD44 pKa = 3.85EE45 pKa = 4.88PVDD48 pKa = 3.62EE49 pKa = 5.21HH50 pKa = 8.46VDD52 pKa = 3.72EE53 pKa = 5.19PVDD56 pKa = 3.57EE57 pKa = 5.21HH58 pKa = 8.46VDD60 pKa = 3.72EE61 pKa = 5.19PVDD64 pKa = 3.57EE65 pKa = 5.21HH66 pKa = 8.46VDD68 pKa = 3.72EE69 pKa = 5.19PVDD72 pKa = 3.57EE73 pKa = 5.21HH74 pKa = 8.48VDD76 pKa = 3.81EE77 pKa = 5.32PVDD80 pKa = 3.84SSDD83 pKa = 4.13SFVIRR88 pKa = 11.84CGLFVSYY95 pKa = 10.39RR96 pKa = 11.84SSSSNEE102 pKa = 3.49
CC1 pKa = 7.78EE2 pKa = 5.95DD3 pKa = 4.11LDD5 pKa = 4.67DD6 pKa = 4.03WTSDD10 pKa = 3.23KK11 pKa = 11.01PPAVCHH17 pKa = 5.41SHH19 pKa = 6.54SLCQDD24 pKa = 3.33EE25 pKa = 5.21PVDD28 pKa = 3.99EE29 pKa = 4.92PVDD32 pKa = 3.93EE33 pKa = 4.85PVDD36 pKa = 4.05DD37 pKa = 4.84PVDD40 pKa = 3.81EE41 pKa = 4.92PVDD44 pKa = 3.85EE45 pKa = 4.88PVDD48 pKa = 3.62EE49 pKa = 5.21HH50 pKa = 8.46VDD52 pKa = 3.72EE53 pKa = 5.19PVDD56 pKa = 3.57EE57 pKa = 5.21HH58 pKa = 8.46VDD60 pKa = 3.72EE61 pKa = 5.19PVDD64 pKa = 3.57EE65 pKa = 5.21HH66 pKa = 8.46VDD68 pKa = 3.72EE69 pKa = 5.19PVDD72 pKa = 3.57EE73 pKa = 5.21HH74 pKa = 8.48VDD76 pKa = 3.81EE77 pKa = 5.32PVDD80 pKa = 3.84SSDD83 pKa = 4.13SFVIRR88 pKa = 11.84CGLFVSYY95 pKa = 10.39RR96 pKa = 11.84SSSSNEE102 pKa = 3.49
Molecular weight: 11.42 kDa
Isoelectric point according different methods:
Protein with the highest isoelectric point:
>tr|A0A2U9CGN6|A0A2U9CGN6_SCOMX Putative TATA box-binding protein-associated factor RNA polymerase I subunit C OS=Scophthalmus maximus OX=52904 GN=SMAX5B_002962 PE=4 SV=1
FF1 pKa = 7.33NFRR4 pKa = 11.84FNFWFNFWFNFRR16 pKa = 11.84FNFWFNFRR24 pKa = 11.84FNFRR28 pKa = 11.84FNFWFNFRR36 pKa = 11.84FNFWFNFWFNFRR48 pKa = 11.84FNFWFNFWFNFRR60 pKa = 11.84FNFRR64 pKa = 11.84FNFRR68 pKa = 11.84FNFWFNFWFNFWFNFRR84 pKa = 11.84FNFRR88 pKa = 11.84FNFWFNFRR96 pKa = 11.84FNFRR100 pKa = 11.84FNFRR104 pKa = 11.84FNFWFNFWFNFWFNFWFNFRR124 pKa = 11.84FNFRR128 pKa = 11.84FNFWFNFRR136 pKa = 11.84FNFRR140 pKa = 11.84FNFRR144 pKa = 11.84FNFRR148 pKa = 11.84FNFRR152 pKa = 11.84FNFWFNFWFNFWFDD166 pKa = 3.18FRR168 pKa = 11.84FNFRR172 pKa = 11.84FNFTFNFWFNFWFNFRR188 pKa = 11.84FNFWFNFRR196 pKa = 11.84FNFWFNFSKK205 pKa = 10.99LKK207 pKa = 9.99TKK209 pKa = 10.76LNRR212 pKa = 11.84FNFWFNFWFNLWFNLWFNFKK232 pKa = 10.31FNCRR236 pKa = 11.84FKK238 pKa = 9.85QTVNFTVNRR247 pKa = 11.84LMASRR252 pKa = 11.84CTTLLNMM259 pKa = 5.21
FF1 pKa = 7.33NFRR4 pKa = 11.84FNFWFNFWFNFRR16 pKa = 11.84FNFWFNFRR24 pKa = 11.84FNFRR28 pKa = 11.84FNFWFNFRR36 pKa = 11.84FNFWFNFWFNFRR48 pKa = 11.84FNFWFNFWFNFRR60 pKa = 11.84FNFRR64 pKa = 11.84FNFRR68 pKa = 11.84FNFWFNFWFNFWFNFRR84 pKa = 11.84FNFRR88 pKa = 11.84FNFWFNFRR96 pKa = 11.84FNFRR100 pKa = 11.84FNFRR104 pKa = 11.84FNFWFNFWFNFWFNFWFNFRR124 pKa = 11.84FNFRR128 pKa = 11.84FNFWFNFRR136 pKa = 11.84FNFRR140 pKa = 11.84FNFRR144 pKa = 11.84FNFRR148 pKa = 11.84FNFRR152 pKa = 11.84FNFWFNFWFNFWFDD166 pKa = 3.18FRR168 pKa = 11.84FNFRR172 pKa = 11.84FNFTFNFWFNFWFNFRR188 pKa = 11.84FNFWFNFRR196 pKa = 11.84FNFWFNFSKK205 pKa = 10.99LKK207 pKa = 9.99TKK209 pKa = 10.76LNRR212 pKa = 11.84FNFWFNFWFNLWFNLWFNFKK232 pKa = 10.31FNCRR236 pKa = 11.84FKK238 pKa = 9.85QTVNFTVNRR247 pKa = 11.84LMASRR252 pKa = 11.84CTTLLNMM259 pKa = 5.21
Molecular weight: 36.43 kDa
Isoelectric point according different methods:
Peptides (in silico digests for buttom-up proteomics)
Below you can find in silico digests of the whole proteome with Trypsin, Chymotrypsin, Trypsin+LysC, LysN, ArgC proteases suitable for different mass spec machines.| Try ESI |
 |
|---|
| ChTry ESI |
|
|---|
| ArgC ESI |
|
|---|
| LysN ESI |
|
|---|
| TryLysC ESI |
|
|---|
| Try MALDI |
|
|---|
| ChTry MALDI |
|
|---|
| ArgC MALDI |
|
|---|
| LysN MALDI |
|
|---|
| TryLysC MALDI |
|
|---|
| Try LTQ |
|
|---|
| ChTry LTQ |
|
|---|
| ArgC LTQ |
|
|---|
| LysN LTQ |
|
|---|
| TryLysC LTQ |
|
|---|
| Try MSlow |
|
|---|
| ChTry MSlow |
|
|---|
| ArgC MSlow |
|
|---|
| LysN MSlow |
|
|---|
| TryLysC MSlow |
|
|---|
| Try MShigh |
|
|---|
| ChTry MShigh |
|
|---|
| ArgC MShigh |
|
|---|
| LysN MShigh |
|
|---|
| TryLysC MShigh |
|
|---|
General Statistics
Number of major isoforms |
Number of additional isoforms |
Number of all proteins |
Number of amino acids |
Min. Seq. Length |
Max. Seq. Length |
Avg. Seq. Length |
Avg. Mol. Weight |
|---|---|---|---|---|---|---|---|
14009638 |
43 |
29347 |
562.0 |
62.61 |
Amino acid frequency
Ala |
Cys |
Asp |
Glu |
Phe |
Gly |
His |
Ile |
Lys |
Leu |
|---|---|---|---|---|---|---|---|---|---|
6.854 ± 0.014 | 2.243 ± 0.014 |
5.316 ± 0.012 | 6.915 ± 0.021 |
3.499 ± 0.012 | 6.434 ± 0.018 |
2.664 ± 0.008 | 4.136 ± 0.012 |
5.451 ± 0.019 | 9.474 ± 0.02 |
Met |
Asn |
Gln |
Pro |
Arg |
Ser |
Thr |
Val |
Trp |
Tyr |
|---|---|---|---|---|---|---|---|---|---|
2.37 ± 0.007 | 3.698 ± 0.009 |
5.71 ± 0.02 | 4.72 ± 0.019 |
5.943 ± 0.015 | 8.652 ± 0.019 |
5.638 ± 0.014 | 6.483 ± 0.015 |
1.145 ± 0.005 | 2.631 ± 0.01 |
Most of the basic statistics you can see at this page can be downloaded from this CSV file
See this proteome in:

Proteome-pI is available under Creative Commons Attribution-NoDerivs license, for more details see here
| Reference: Kozlowski LP. Proteome-pI 2.0: Proteome Isoelectric Point Database Update. Nucleic Acids Res. 2021, doi: 10.1093/nar/gkab944 | Contact: Lukasz P. Kozlowski |