Paenibacillus zeisoli
Taxonomy: cellular organisms; Bacteria; Terrabacteria group; Firmicutes; Bacilli; Bacillales; Paenibacillaceae; Paenibacillus
Average proteome isoelectric point is 6.33
Get precalculated fractions of proteins
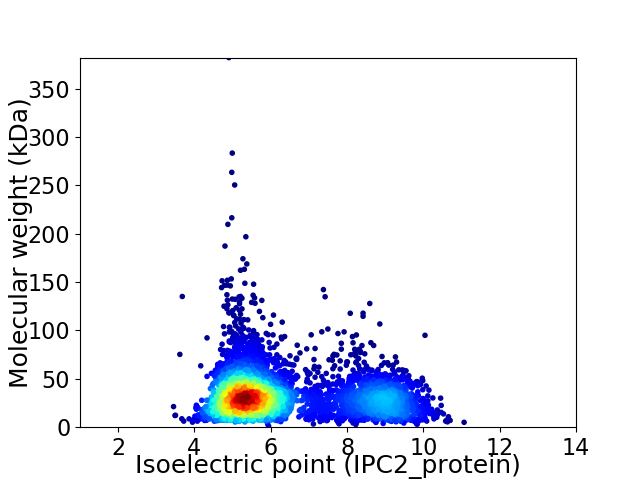
Virtual 2D-PAGE plot for 4013 proteins (isoelectric point calculated using IPC2_protein)
Get csv file with sequences according to given criteria:
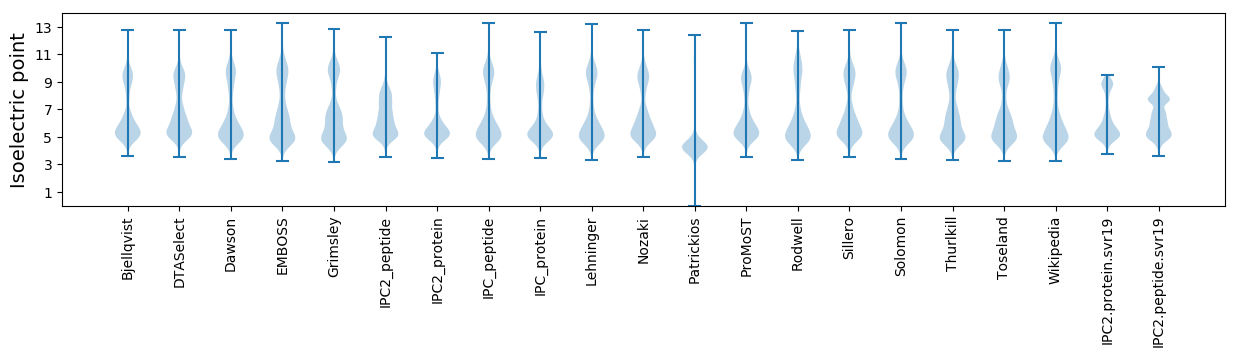
* You can choose from 21 different methods for calculating isoelectric point
Summary statistics related to proteome-wise predictions
Protein with the lowest isoelectric point:
>tr|A0A433XIC4|A0A433XIC4_9BACL FtsX-like permease family protein OS=Paenibacillus zeisoli OX=2496267 GN=EJP77_08305 PE=4 SV=1
MM1 pKa = 7.1YY2 pKa = 10.04VVCKK6 pKa = 10.56DD7 pKa = 3.58HH8 pKa = 7.48VEE10 pKa = 3.96LAIDD14 pKa = 3.47MFVDD18 pKa = 3.92EE19 pKa = 6.03FEE21 pKa = 4.76DD22 pKa = 4.47APDD25 pKa = 3.53IVDD28 pKa = 3.83LKK30 pKa = 10.11EE31 pKa = 4.31TEE33 pKa = 4.15FSDD36 pKa = 2.87WDD38 pKa = 3.93PPVKK42 pKa = 10.44CSQCDD47 pKa = 3.3QAAVFLVVV55 pKa = 3.66
MM1 pKa = 7.1YY2 pKa = 10.04VVCKK6 pKa = 10.56DD7 pKa = 3.58HH8 pKa = 7.48VEE10 pKa = 3.96LAIDD14 pKa = 3.47MFVDD18 pKa = 3.92EE19 pKa = 6.03FEE21 pKa = 4.76DD22 pKa = 4.47APDD25 pKa = 3.53IVDD28 pKa = 3.83LKK30 pKa = 10.11EE31 pKa = 4.31TEE33 pKa = 4.15FSDD36 pKa = 2.87WDD38 pKa = 3.93PPVKK42 pKa = 10.44CSQCDD47 pKa = 3.3QAAVFLVVV55 pKa = 3.66
Molecular weight: 6.3 kDa
Isoelectric point according different methods:
Protein with the highest isoelectric point:
>tr|A0A433XI74|A0A433XI74_9BACL Uncharacterized protein OS=Paenibacillus zeisoli OX=2496267 GN=EJP77_06455 PE=4 SV=1
MM1 pKa = 7.59KK2 pKa = 8.7PTFKK6 pKa = 10.72PNVSKK11 pKa = 10.78RR12 pKa = 11.84SKK14 pKa = 9.04VHH16 pKa = 5.83GFRR19 pKa = 11.84KK20 pKa = 10.02RR21 pKa = 11.84MSTKK25 pKa = 10.18NGRR28 pKa = 11.84KK29 pKa = 8.87VLAARR34 pKa = 11.84RR35 pKa = 11.84LKK37 pKa = 10.2GRR39 pKa = 11.84KK40 pKa = 8.79VLSAA44 pKa = 4.05
MM1 pKa = 7.59KK2 pKa = 8.7PTFKK6 pKa = 10.72PNVSKK11 pKa = 10.78RR12 pKa = 11.84SKK14 pKa = 9.04VHH16 pKa = 5.83GFRR19 pKa = 11.84KK20 pKa = 10.02RR21 pKa = 11.84MSTKK25 pKa = 10.18NGRR28 pKa = 11.84KK29 pKa = 8.87VLAARR34 pKa = 11.84RR35 pKa = 11.84LKK37 pKa = 10.2GRR39 pKa = 11.84KK40 pKa = 8.79VLSAA44 pKa = 4.05
Molecular weight: 5.05 kDa
Isoelectric point according different methods:
Peptides (in silico digests for buttom-up proteomics)
Below you can find in silico digests of the whole proteome with Trypsin, Chymotrypsin, Trypsin+LysC, LysN, ArgC proteases suitable for different mass spec machines.| Try ESI |
 |
|---|
| ChTry ESI |
|
|---|
| ArgC ESI |
|
|---|
| LysN ESI |
|
|---|
| TryLysC ESI |
|
|---|
| Try MALDI |
|
|---|
| ChTry MALDI |
|
|---|
| ArgC MALDI |
|
|---|
| LysN MALDI |
|
|---|
| TryLysC MALDI |
|
|---|
| Try LTQ |
|
|---|
| ChTry LTQ |
|
|---|
| ArgC LTQ |
|
|---|
| LysN LTQ |
|
|---|
| TryLysC LTQ |
|
|---|
| Try MSlow |
|
|---|
| ChTry MSlow |
|
|---|
| ArgC MSlow |
|
|---|
| LysN MSlow |
|
|---|
| TryLysC MSlow |
|
|---|
| Try MShigh |
|
|---|
| ChTry MShigh |
|
|---|
| ArgC MShigh |
|
|---|
| LysN MShigh |
|
|---|
| TryLysC MShigh |
|
|---|
General Statistics
Number of major isoforms |
Number of additional isoforms |
Number of all proteins |
Number of amino acids |
Min. Seq. Length |
Max. Seq. Length |
Avg. Seq. Length |
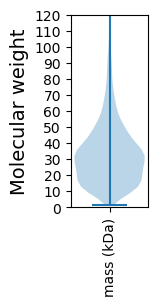
Avg. Mol. Weight |
|---|---|---|---|---|---|---|---|
0 |
1259114 |
11 |
3386 |
313.8 |
34.88 |
Amino acid frequency
Ala |
Cys |
Asp |
Glu |
Phe |
Gly |
His |
Ile |
Lys |
Leu |
|---|---|---|---|---|---|---|---|---|---|
8.041 ± 0.04 | 0.707 ± 0.012 |
5.063 ± 0.03 | 6.792 ± 0.05 |
3.955 ± 0.027 | 7.573 ± 0.04 |
2.132 ± 0.022 | 6.866 ± 0.032 |
5.489 ± 0.04 | 10.163 ± 0.051 |
Met |
Asn |
Gln |
Pro |
Arg |
Ser |
Thr |
Val |
Trp |
Tyr |
|---|---|---|---|---|---|---|---|---|---|
2.722 ± 0.02 | 3.793 ± 0.03 |
4.017 ± 0.025 | 3.931 ± 0.025 |
4.967 ± 0.035 | 6.613 ± 0.035 |
5.469 ± 0.042 | 7.105 ± 0.03 |
1.179 ± 0.015 | 3.422 ± 0.021 |
Most of the basic statistics you can see at this page can be downloaded from this CSV file
See this proteome in:

Proteome-pI is available under Creative Commons Attribution-NoDerivs license, for more details see here
| Reference: Kozlowski LP. Proteome-pI 2.0: Proteome Isoelectric Point Database Update. Nucleic Acids Res. 2021, doi: 10.1093/nar/gkab944 | Contact: Lukasz P. Kozlowski |