Hoeflea halophila
Taxonomy: cellular organisms; Bacteria; Proteobacteria; Alphaproteobacteria; Hyphomicrobiales; Phyllobacteriaceae; Hoeflea
Average proteome isoelectric point is 6.2
Get precalculated fractions of proteins
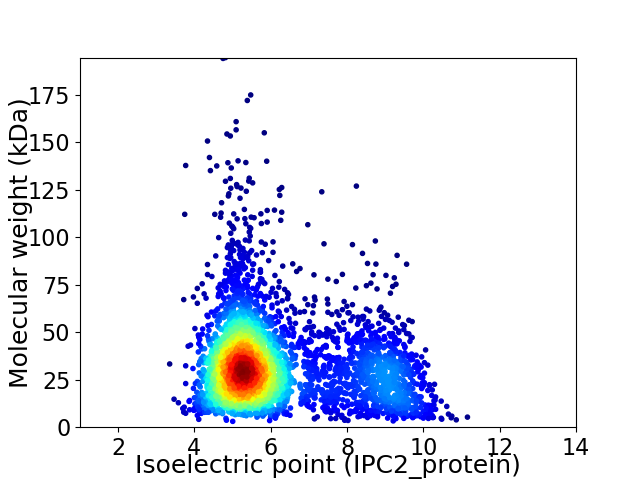
Virtual 2D-PAGE plot for 3883 proteins (isoelectric point calculated using IPC2_protein)
Get csv file with sequences according to given criteria:
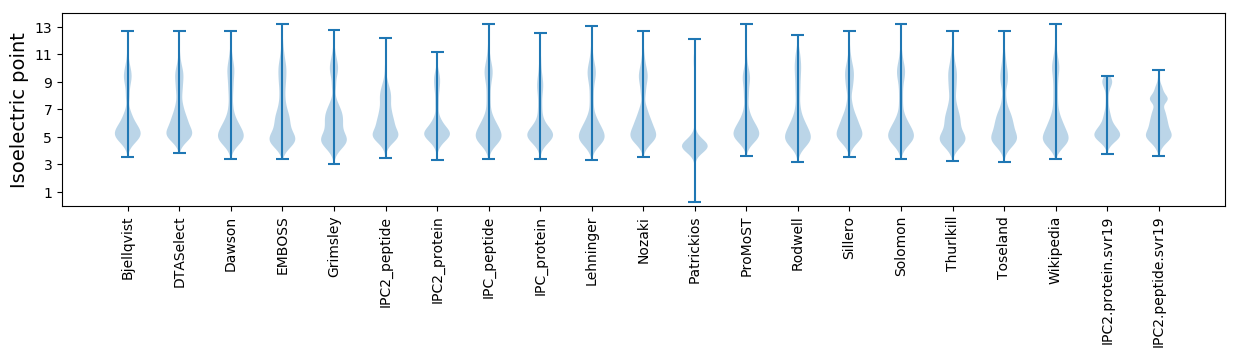
* You can choose from 21 different methods for calculating isoelectric point
Summary statistics related to proteome-wise predictions
Protein with the lowest isoelectric point:
>tr|A0A286IFT3|A0A286IFT3_9RHIZ Uncharacterized protein OS=Hoeflea halophila OX=714899 GN=SAMN05877838_3072 PE=4 SV=1
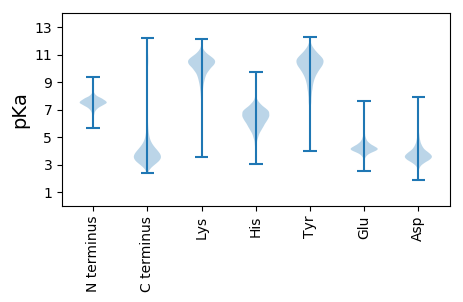
MM1 pKa = 7.44SLFGMMQSGVSGMNAQANRR20 pKa = 11.84LSTVADD26 pKa = 4.22NIQNSSTPGYY36 pKa = 10.27KK37 pKa = 9.77RR38 pKa = 11.84ATTAFSSLILPTTAGSYY55 pKa = 10.83NSGAVKK61 pKa = 9.96TSVQYY66 pKa = 10.72DD67 pKa = 3.38ISTSGSPEE75 pKa = 3.61FTTSNTNLAIDD86 pKa = 3.79GNGFFIVSDD95 pKa = 4.02SNGSPFLTRR104 pKa = 11.84NGAFSKK110 pKa = 11.01DD111 pKa = 3.06GDD113 pKa = 4.11GNLVNSAGFTLMGYY127 pKa = 9.9DD128 pKa = 3.71YY129 pKa = 10.86TGGAPAPVVNGFDD142 pKa = 3.18GLVPVNVNSAGLTATPSTNGLFYY165 pKa = 11.43ANLNDD170 pKa = 3.78AATVVAAADD179 pKa = 3.96LPSANAVTAEE189 pKa = 4.03YY190 pKa = 10.19SHH192 pKa = 6.8KK193 pKa = 10.65SSLVVYY199 pKa = 7.84DD200 pKa = 3.74TVGKK204 pKa = 10.12EE205 pKa = 3.88VLLDD209 pKa = 3.74FYY211 pKa = 9.64YY212 pKa = 10.84TKK214 pKa = 10.29TADD217 pKa = 4.31DD218 pKa = 3.56NWEE221 pKa = 3.9VAVYY225 pKa = 10.29DD226 pKa = 4.24RR227 pKa = 11.84AAATPGTGFPYY238 pKa = 10.68GSGPLATQNLVFDD251 pKa = 4.56PALNGALAAASPTSIAMTVPGGAALTIDD279 pKa = 4.62LKK281 pKa = 11.75DD282 pKa = 3.51MTQLNYY288 pKa = 10.74EE289 pKa = 4.25FTVDD293 pKa = 4.14DD294 pKa = 4.81ADD296 pKa = 4.1VNGNAPSAVTDD307 pKa = 3.62VEE309 pKa = 4.51VAADD313 pKa = 3.49GTVYY317 pKa = 10.97AKK319 pKa = 10.97YY320 pKa = 10.55EE321 pKa = 4.2NGDD324 pKa = 4.07LRR326 pKa = 11.84PMYY329 pKa = 9.89QVALATVPSPDD340 pKa = 3.65NLIPLPGNVYY350 pKa = 10.64AQGIDD355 pKa = 3.25SGVITTGFAGTGGFGGLISNAVEE378 pKa = 3.99GSNVDD383 pKa = 3.01IAQEE387 pKa = 4.11LTDD390 pKa = 4.34MIASQRR396 pKa = 11.84SYY398 pKa = 9.73TANSKK403 pKa = 9.74VFQTGSDD410 pKa = 3.68LLDD413 pKa = 3.1VLVNLKK419 pKa = 10.3RR420 pKa = 3.6
MM1 pKa = 7.44SLFGMMQSGVSGMNAQANRR20 pKa = 11.84LSTVADD26 pKa = 4.22NIQNSSTPGYY36 pKa = 10.27KK37 pKa = 9.77RR38 pKa = 11.84ATTAFSSLILPTTAGSYY55 pKa = 10.83NSGAVKK61 pKa = 9.96TSVQYY66 pKa = 10.72DD67 pKa = 3.38ISTSGSPEE75 pKa = 3.61FTTSNTNLAIDD86 pKa = 3.79GNGFFIVSDD95 pKa = 4.02SNGSPFLTRR104 pKa = 11.84NGAFSKK110 pKa = 11.01DD111 pKa = 3.06GDD113 pKa = 4.11GNLVNSAGFTLMGYY127 pKa = 9.9DD128 pKa = 3.71YY129 pKa = 10.86TGGAPAPVVNGFDD142 pKa = 3.18GLVPVNVNSAGLTATPSTNGLFYY165 pKa = 11.43ANLNDD170 pKa = 3.78AATVVAAADD179 pKa = 3.96LPSANAVTAEE189 pKa = 4.03YY190 pKa = 10.19SHH192 pKa = 6.8KK193 pKa = 10.65SSLVVYY199 pKa = 7.84DD200 pKa = 3.74TVGKK204 pKa = 10.12EE205 pKa = 3.88VLLDD209 pKa = 3.74FYY211 pKa = 9.64YY212 pKa = 10.84TKK214 pKa = 10.29TADD217 pKa = 4.31DD218 pKa = 3.56NWEE221 pKa = 3.9VAVYY225 pKa = 10.29DD226 pKa = 4.24RR227 pKa = 11.84AAATPGTGFPYY238 pKa = 10.68GSGPLATQNLVFDD251 pKa = 4.56PALNGALAAASPTSIAMTVPGGAALTIDD279 pKa = 4.62LKK281 pKa = 11.75DD282 pKa = 3.51MTQLNYY288 pKa = 10.74EE289 pKa = 4.25FTVDD293 pKa = 4.14DD294 pKa = 4.81ADD296 pKa = 4.1VNGNAPSAVTDD307 pKa = 3.62VEE309 pKa = 4.51VAADD313 pKa = 3.49GTVYY317 pKa = 10.97AKK319 pKa = 10.97YY320 pKa = 10.55EE321 pKa = 4.2NGDD324 pKa = 4.07LRR326 pKa = 11.84PMYY329 pKa = 9.89QVALATVPSPDD340 pKa = 3.65NLIPLPGNVYY350 pKa = 10.64AQGIDD355 pKa = 3.25SGVITTGFAGTGGFGGLISNAVEE378 pKa = 3.99GSNVDD383 pKa = 3.01IAQEE387 pKa = 4.11LTDD390 pKa = 4.34MIASQRR396 pKa = 11.84SYY398 pKa = 9.73TANSKK403 pKa = 9.74VFQTGSDD410 pKa = 3.68LLDD413 pKa = 3.1VLVNLKK419 pKa = 10.3RR420 pKa = 3.6
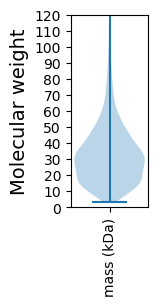
Molecular weight: 43.25 kDa
Isoelectric point according different methods:
Protein with the highest isoelectric point:
>tr|A0A286IFD2|A0A286IFD2_9RHIZ Enolase OS=Hoeflea halophila OX=714899 GN=eno PE=3 SV=1
MM1 pKa = 7.62TKK3 pKa = 9.11RR4 pKa = 11.84TYY6 pKa = 10.36QPSKK10 pKa = 9.73LVRR13 pKa = 11.84KK14 pKa = 9.15RR15 pKa = 11.84RR16 pKa = 11.84HH17 pKa = 4.42GFRR20 pKa = 11.84ARR22 pKa = 11.84MATKK26 pKa = 10.27GGRR29 pKa = 11.84KK30 pKa = 9.17VIQARR35 pKa = 11.84RR36 pKa = 11.84ARR38 pKa = 11.84GRR40 pKa = 11.84NRR42 pKa = 11.84LSAA45 pKa = 3.96
MM1 pKa = 7.62TKK3 pKa = 9.11RR4 pKa = 11.84TYY6 pKa = 10.36QPSKK10 pKa = 9.73LVRR13 pKa = 11.84KK14 pKa = 9.15RR15 pKa = 11.84RR16 pKa = 11.84HH17 pKa = 4.42GFRR20 pKa = 11.84ARR22 pKa = 11.84MATKK26 pKa = 10.27GGRR29 pKa = 11.84KK30 pKa = 9.17VIQARR35 pKa = 11.84RR36 pKa = 11.84ARR38 pKa = 11.84GRR40 pKa = 11.84NRR42 pKa = 11.84LSAA45 pKa = 3.96
Molecular weight: 5.31 kDa
Isoelectric point according different methods:
Peptides (in silico digests for buttom-up proteomics)
Below you can find in silico digests of the whole proteome with Trypsin, Chymotrypsin, Trypsin+LysC, LysN, ArgC proteases suitable for different mass spec machines.| Try ESI |
 |
|---|
| ChTry ESI |
|
|---|
| ArgC ESI |
|
|---|
| LysN ESI |
|
|---|
| TryLysC ESI |
|
|---|
| Try MALDI |
|
|---|
| ChTry MALDI |
|
|---|
| ArgC MALDI |
|
|---|
| LysN MALDI |
|
|---|
| TryLysC MALDI |
|
|---|
| Try LTQ |
|
|---|
| ChTry LTQ |
|
|---|
| ArgC LTQ |
|
|---|
| LysN LTQ |
|
|---|
| TryLysC LTQ |
|
|---|
| Try MSlow |
|
|---|
| ChTry MSlow |
|
|---|
| ArgC MSlow |
|
|---|
| LysN MSlow |
|
|---|
| TryLysC MSlow |
|
|---|
| Try MShigh |
|
|---|
| ChTry MShigh |
|
|---|
| ArgC MShigh |
|
|---|
| LysN MShigh |
|
|---|
| TryLysC MShigh |
|
|---|
General Statistics
Number of major isoforms |
Number of additional isoforms |
Number of all proteins |
Number of amino acids |
Min. Seq. Length |
Max. Seq. Length |
Avg. Seq. Length |
Avg. Mol. Weight |
|---|---|---|---|---|---|---|---|
0 |
1229019 |
29 |
1822 |
316.5 |
34.36 |
Amino acid frequency
Ala |
Cys |
Asp |
Glu |
Phe |
Gly |
His |
Ile |
Lys |
Leu |
|---|---|---|---|---|---|---|---|---|---|
11.966 ± 0.048 | 0.844 ± 0.012 |
5.833 ± 0.029 | 6.034 ± 0.038 |
3.846 ± 0.026 | 8.547 ± 0.034 |
2.022 ± 0.02 | 5.598 ± 0.025 |
3.522 ± 0.031 | 9.801 ± 0.048 |
Met |
Asn |
Gln |
Pro |
Arg |
Ser |
Thr |
Val |
Trp |
Tyr |
|---|---|---|---|---|---|---|---|---|---|
2.771 ± 0.018 | 2.796 ± 0.021 |
4.901 ± 0.027 | 3.035 ± 0.022 |
6.56 ± 0.039 | 5.841 ± 0.024 |
5.312 ± 0.024 | 7.288 ± 0.029 |
1.273 ± 0.014 | 2.212 ± 0.017 |
Most of the basic statistics you can see at this page can be downloaded from this CSV file
See this proteome in:

Proteome-pI is available under Creative Commons Attribution-NoDerivs license, for more details see here
| Reference: Kozlowski LP. Proteome-pI 2.0: Proteome Isoelectric Point Database Update. Nucleic Acids Res. 2021, doi: 10.1093/nar/gkab944 | Contact: Lukasz P. Kozlowski |