Escherichia phage SH2026Stx1
Taxonomy: Viruses; Duplodnaviria; Heunggongvirae; Uroviricota; Caudoviricetes; Caudovirales; Podoviridae; Sepvirinae; Traversvirus; Escherichia virus SH2026Stx1
Average proteome isoelectric point is 7.21
Get precalculated fractions of proteins
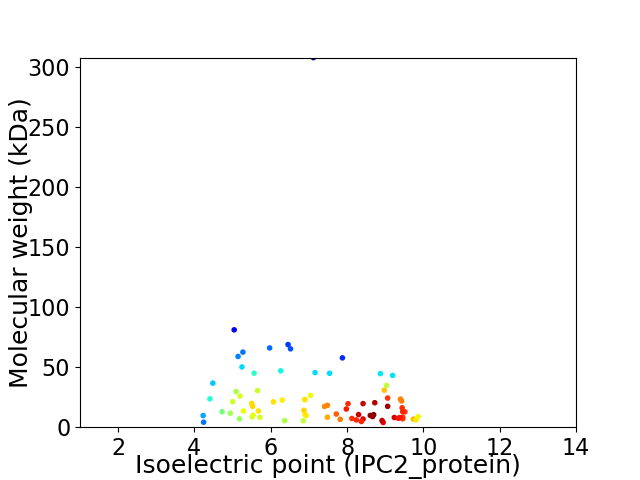
Virtual 2D-PAGE plot for 79 proteins (isoelectric point calculated using IPC2_protein)
Get csv file with sequences according to given criteria:
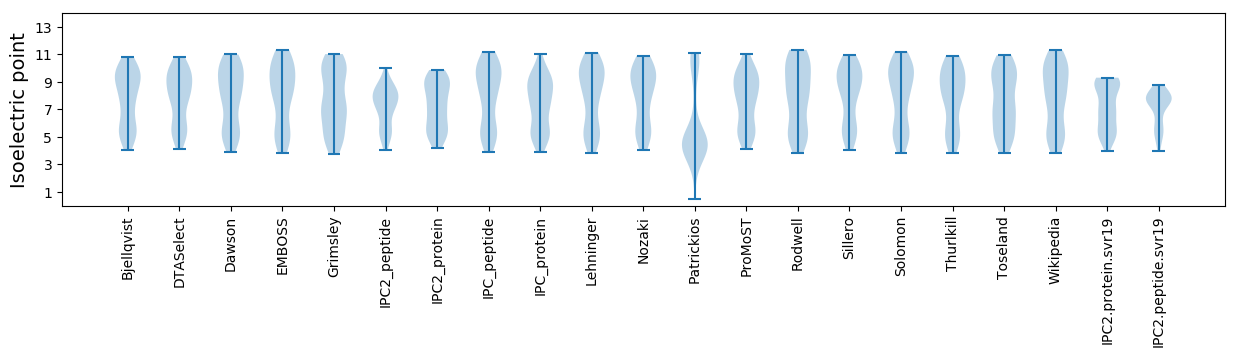
* You can choose from 21 different methods for calculating isoelectric point
Summary statistics related to proteome-wise predictions
Protein with the lowest isoelectric point:
>tr|A0A2S0M3F3|A0A2S0M3F3_9CAUD Putative HNH endonuclease OS=Escherichia phage SH2026Stx1 OX=2108115 GN=SH2026Stx1_00038 PE=4 SV=1
MM1 pKa = 7.27QLFSPSWYY9 pKa = 10.21CGNTDD14 pKa = 2.46IHH16 pKa = 7.81SFGEE20 pKa = 4.39LCSGGQIQKK29 pKa = 9.43TITEE33 pKa = 4.23EE34 pKa = 4.03EE35 pKa = 4.41GDD37 pKa = 3.84GG38 pKa = 4.01
MM1 pKa = 7.27QLFSPSWYY9 pKa = 10.21CGNTDD14 pKa = 2.46IHH16 pKa = 7.81SFGEE20 pKa = 4.39LCSGGQIQKK29 pKa = 9.43TITEE33 pKa = 4.23EE34 pKa = 4.03EE35 pKa = 4.41GDD37 pKa = 3.84GG38 pKa = 4.01
Molecular weight: 4.17 kDa
Isoelectric point according different methods:
Protein with the highest isoelectric point:
>tr|A0A2S0M3E6|A0A2S0M3E6_9CAUD Transposase OS=Escherichia phage SH2026Stx1 OX=2108115 GN=SH2026Stx1_00014 PE=4 SV=1
MM1 pKa = 6.89TKK3 pKa = 9.97RR4 pKa = 11.84RR5 pKa = 11.84KK6 pKa = 9.59KK7 pKa = 8.64YY8 pKa = 8.27QEE10 pKa = 3.91KK11 pKa = 10.86EE12 pKa = 4.34EE13 pKa = 4.08IRR15 pKa = 11.84HH16 pKa = 5.8PDD18 pKa = 3.24SPEE21 pKa = 3.86GLVVAAANNRR31 pKa = 11.84AFAEE35 pKa = 4.16RR36 pKa = 11.84LVGVYY41 pKa = 9.93RR42 pKa = 11.84LAKK45 pKa = 10.37AGVKK49 pKa = 9.75HH50 pKa = 5.82GRR52 pKa = 11.84RR53 pKa = 3.65
MM1 pKa = 6.89TKK3 pKa = 9.97RR4 pKa = 11.84RR5 pKa = 11.84KK6 pKa = 9.59KK7 pKa = 8.64YY8 pKa = 8.27QEE10 pKa = 3.91KK11 pKa = 10.86EE12 pKa = 4.34EE13 pKa = 4.08IRR15 pKa = 11.84HH16 pKa = 5.8PDD18 pKa = 3.24SPEE21 pKa = 3.86GLVVAAANNRR31 pKa = 11.84AFAEE35 pKa = 4.16RR36 pKa = 11.84LVGVYY41 pKa = 9.93RR42 pKa = 11.84LAKK45 pKa = 10.37AGVKK49 pKa = 9.75HH50 pKa = 5.82GRR52 pKa = 11.84RR53 pKa = 3.65
Molecular weight: 6.09 kDa
Isoelectric point according different methods:
Peptides (in silico digests for buttom-up proteomics)
Below you can find in silico digests of the whole proteome with Trypsin, Chymotrypsin, Trypsin+LysC, LysN, ArgC proteases suitable for different mass spec machines.| Try ESI |
 |
|---|
| ChTry ESI |
|
|---|
| ArgC ESI |
|
|---|
| LysN ESI |
|
|---|
| TryLysC ESI |
|
|---|
| Try MALDI |
|
|---|
| ChTry MALDI |
|
|---|
| ArgC MALDI |
|
|---|
| LysN MALDI |
|
|---|
| TryLysC MALDI |
|
|---|
| Try LTQ |
|
|---|
| ChTry LTQ |
|
|---|
| ArgC LTQ |
|
|---|
| LysN LTQ |
|
|---|
| TryLysC LTQ |
|
|---|
| Try MSlow |
|
|---|
| ChTry MSlow |
|
|---|
| ArgC MSlow |
|
|---|
| LysN MSlow |
|
|---|
| TryLysC MSlow |
|
|---|
| Try MShigh |
|
|---|
| ChTry MShigh |
|
|---|
| ArgC MShigh |
|
|---|
| LysN MShigh |
|
|---|
| TryLysC MShigh |
|
|---|
General Statistics
Number of major isoforms |
Number of additional isoforms |
Number of all proteins |
Number of amino acids |
Min. Seq. Length |
Max. Seq. Length |
Avg. Seq. Length |
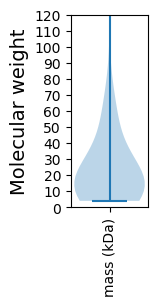
Avg. Mol. Weight |
|---|---|---|---|---|---|---|---|
0 |
18146 |
34 |
2794 |
229.7 |
25.55 |
Amino acid frequency
Ala |
Cys |
Asp |
Glu |
Phe |
Gly |
His |
Ile |
Lys |
Leu |
|---|---|---|---|---|---|---|---|---|---|
9.517 ± 0.414 | 1.174 ± 0.187 |
5.83 ± 0.185 | 6.574 ± 0.287 |
3.108 ± 0.146 | 7.324 ± 0.488 |
1.769 ± 0.129 | 5.169 ± 0.345 |
5.864 ± 0.266 | 8.244 ± 0.332 |
Met |
Asn |
Gln |
Pro |
Arg |
Ser |
Thr |
Val |
Trp |
Tyr |
|---|---|---|---|---|---|---|---|---|---|
2.706 ± 0.14 | 4.282 ± 0.207 |
4.359 ± 0.255 | 4.497 ± 0.277 |
6.927 ± 0.317 | 6.371 ± 0.235 |
5.632 ± 0.251 | 6.387 ± 0.249 |
1.411 ± 0.14 | 2.855 ± 0.165 |
Most of the basic statistics you can see at this page can be downloaded from this CSV file
See this proteome in:

Proteome-pI is available under Creative Commons Attribution-NoDerivs license, for more details see here
| Reference: Kozlowski LP. Proteome-pI 2.0: Proteome Isoelectric Point Database Update. Nucleic Acids Res. 2021, doi: 10.1093/nar/gkab944 | Contact: Lukasz P. Kozlowski |