Rickettsia prowazekii (strain Madrid E)
Taxonomy: cellular organisms; Bacteria; Proteobacteria; Alphaproteobacteria; Rickettsiales; Rickettsiaceae; Rickettsieae; Rickettsia; typhus group; Rickettsia prowazekii
Average proteome isoelectric point is 7.43
Get precalculated fractions of proteins
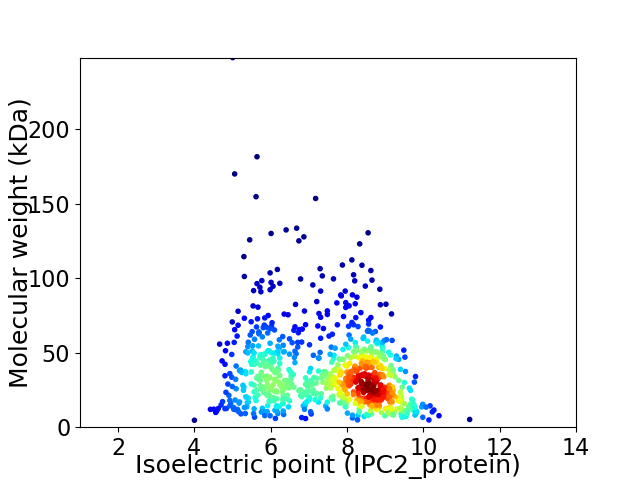
Virtual 2D-PAGE plot for 832 proteins (isoelectric point calculated using IPC2_protein)
Get csv file with sequences according to given criteria:
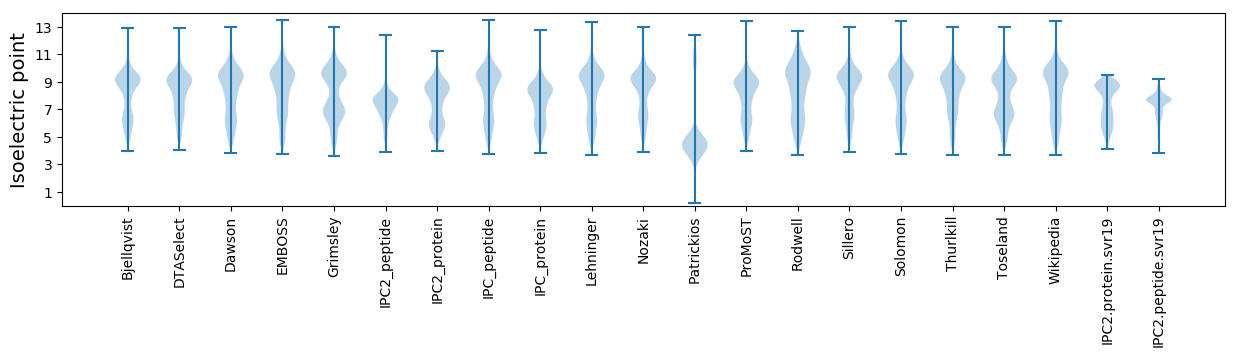
* You can choose from 21 different methods for calculating isoelectric point
Summary statistics related to proteome-wise predictions
Protein with the lowest isoelectric point:
>sp|Q9ZE10|GATA_RICPR Glutamyl-tRNA(Gln) amidotransferase subunit A OS=Rickettsia prowazekii (strain Madrid E) OX=272947 GN=gatA PE=3 SV=1
MM1 pKa = 7.5EE2 pKa = 5.49FCTNTIDD9 pKa = 3.87TISYY13 pKa = 6.28TTHH16 pKa = 6.53EE17 pKa = 4.95SIEE20 pKa = 4.08EE21 pKa = 4.11PNLKK25 pKa = 10.37EE26 pKa = 5.45KK27 pKa = 10.7DD28 pKa = 3.48IEE30 pKa = 4.93DD31 pKa = 4.19DD32 pKa = 3.99LVVVSLIGNN41 pKa = 4.29
MM1 pKa = 7.5EE2 pKa = 5.49FCTNTIDD9 pKa = 3.87TISYY13 pKa = 6.28TTHH16 pKa = 6.53EE17 pKa = 4.95SIEE20 pKa = 4.08EE21 pKa = 4.11PNLKK25 pKa = 10.37EE26 pKa = 5.45KK27 pKa = 10.7DD28 pKa = 3.48IEE30 pKa = 4.93DD31 pKa = 4.19DD32 pKa = 3.99LVVVSLIGNN41 pKa = 4.29
Molecular weight: 4.66 kDa
Isoelectric point according different methods:
Protein with the highest isoelectric point:
>sp|Q9ZCV6|BCRH_RICPR Uncharacterized transporter RP603 OS=Rickettsia prowazekii (strain Madrid E) OX=272947 GN=RP603 PE=3 SV=1
MM1 pKa = 7.45KK2 pKa = 9.61RR3 pKa = 11.84TFQPSNLVRR12 pKa = 11.84KK13 pKa = 9.18RR14 pKa = 11.84RR15 pKa = 11.84HH16 pKa = 4.43GFRR19 pKa = 11.84ARR21 pKa = 11.84MITATGRR28 pKa = 11.84AILKK32 pKa = 9.81KK33 pKa = 9.59RR34 pKa = 11.84RR35 pKa = 11.84AKK37 pKa = 10.3GRR39 pKa = 11.84HH40 pKa = 5.49KK41 pKa = 10.9LSAA44 pKa = 3.8
MM1 pKa = 7.45KK2 pKa = 9.61RR3 pKa = 11.84TFQPSNLVRR12 pKa = 11.84KK13 pKa = 9.18RR14 pKa = 11.84RR15 pKa = 11.84HH16 pKa = 4.43GFRR19 pKa = 11.84ARR21 pKa = 11.84MITATGRR28 pKa = 11.84AILKK32 pKa = 9.81KK33 pKa = 9.59RR34 pKa = 11.84RR35 pKa = 11.84AKK37 pKa = 10.3GRR39 pKa = 11.84HH40 pKa = 5.49KK41 pKa = 10.9LSAA44 pKa = 3.8
Molecular weight: 5.19 kDa
Isoelectric point according different methods:
Peptides (in silico digests for buttom-up proteomics)
Below you can find in silico digests of the whole proteome with Trypsin, Chymotrypsin, Trypsin+LysC, LysN, ArgC proteases suitable for different mass spec machines.| Try ESI |
 |
|---|
| ChTry ESI |
|
|---|
| ArgC ESI |
|
|---|
| LysN ESI |
|
|---|
| TryLysC ESI |
|
|---|
| Try MALDI |
|
|---|
| ChTry MALDI |
|
|---|
| ArgC MALDI |
|
|---|
| LysN MALDI |
|
|---|
| TryLysC MALDI |
|
|---|
| Try LTQ |
|
|---|
| ChTry LTQ |
|
|---|
| ArgC LTQ |
|
|---|
| LysN LTQ |
|
|---|
| TryLysC LTQ |
|
|---|
| Try MSlow |
|
|---|
| ChTry MSlow |
|
|---|
| ArgC MSlow |
|
|---|
| LysN MSlow |
|
|---|
| TryLysC MSlow |
|
|---|
| Try MShigh |
|
|---|
| ChTry MShigh |
|
|---|
| ArgC MShigh |
|
|---|
| LysN MShigh |
|
|---|
| TryLysC MShigh |
|
|---|
General Statistics
Number of major isoforms |
Number of additional isoforms |
Number of all proteins |
Number of amino acids |
Min. Seq. Length |
Max. Seq. Length |
Avg. Seq. Length |
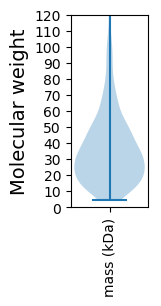
Avg. Mol. Weight |
|---|---|---|---|---|---|---|---|
0 |
278968 |
41 |
2340 |
335.3 |
37.91 |
Amino acid frequency
Ala |
Cys |
Asp |
Glu |
Phe |
Gly |
His |
Ile |
Lys |
Leu |
|---|---|---|---|---|---|---|---|---|---|
6.054 ± 0.071 | 1.094 ± 0.031 |
4.84 ± 0.057 | 5.789 ± 0.08 |
4.871 ± 0.067 | 5.428 ± 0.083 |
1.912 ± 0.034 | 10.879 ± 0.092 |
8.378 ± 0.084 | 10.093 ± 0.085 |
Met |
Asn |
Gln |
Pro |
Arg |
Ser |
Thr |
Val |
Trp |
Tyr |
|---|---|---|---|---|---|---|---|---|---|
2.165 ± 0.036 | 6.648 ± 0.115 |
3.151 ± 0.052 | 3.144 ± 0.037 |
3.391 ± 0.053 | 6.75 ± 0.057 |
5.213 ± 0.074 | 5.596 ± 0.062 |
0.718 ± 0.025 | 3.885 ± 0.055 |
Most of the basic statistics you can see at this page can be downloaded from this CSV file
See this proteome in:

Proteome-pI is available under Creative Commons Attribution-NoDerivs license, for more details see here
| Reference: Kozlowski LP. Proteome-pI 2.0: Proteome Isoelectric Point Database Update. Nucleic Acids Res. 2021, doi: 10.1093/nar/gkab944 | Contact: Lukasz P. Kozlowski |