Hydromonas duriensis
Taxonomy: cellular organisms; Bacteria; Proteobacteria; Betaproteobacteria; Burkholderiales; Burkholderiaceae; Hydromonas
Average proteome isoelectric point is 6.66
Get precalculated fractions of proteins
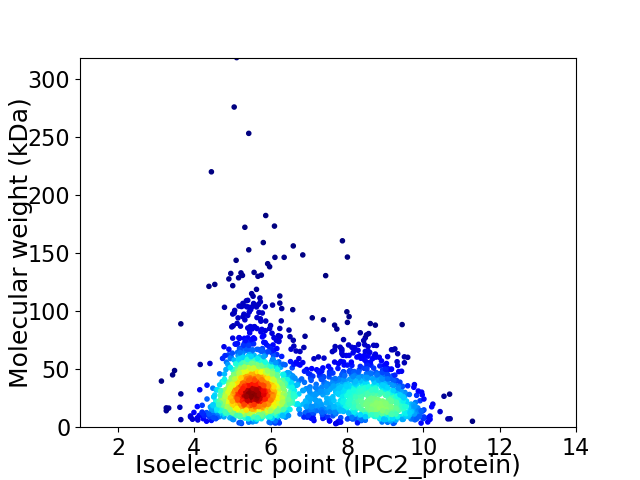
Virtual 2D-PAGE plot for 2252 proteins (isoelectric point calculated using IPC2_protein)
Get csv file with sequences according to given criteria:
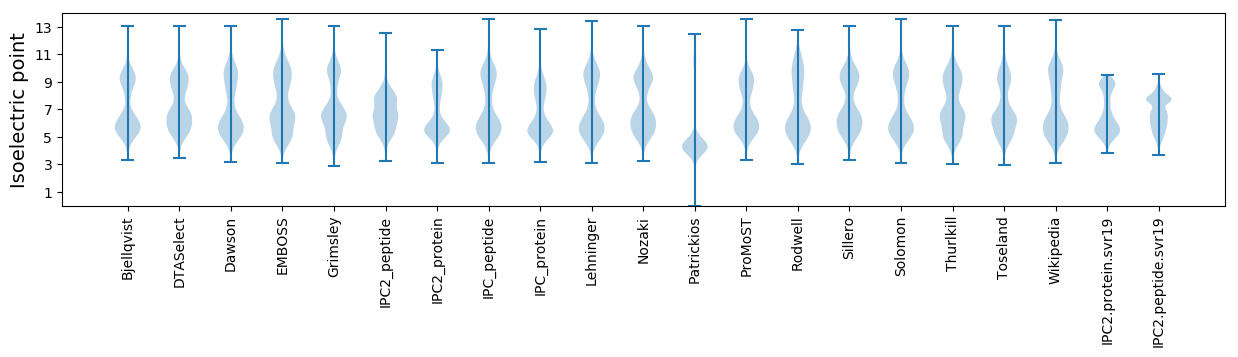
* You can choose from 21 different methods for calculating isoelectric point
Summary statistics related to proteome-wise predictions
Protein with the lowest isoelectric point:
>tr|A0A4R6Y9M4|A0A4R6Y9M4_9BURK Cytochrome c biogenesis protein OS=Hydromonas duriensis OX=1527608 GN=DFR44_10566 PE=4 SV=1
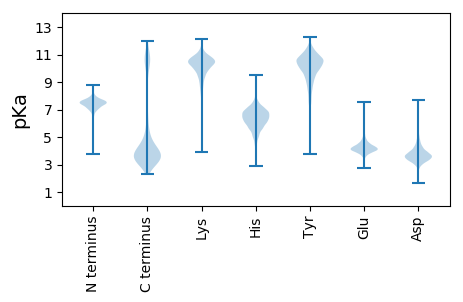
MM1 pKa = 7.02TAVLTVFIVFLLFCVLSSAFSSSQKK26 pKa = 10.27KK27 pKa = 10.29GSQTGSQTSNSSIDD41 pKa = 3.46TSASTDD47 pKa = 3.67SNDD50 pKa = 3.18ACSDD54 pKa = 3.53GGDD57 pKa = 4.0CGDD60 pKa = 4.62GGGGCDD66 pKa = 3.43
MM1 pKa = 7.02TAVLTVFIVFLLFCVLSSAFSSSQKK26 pKa = 10.27KK27 pKa = 10.29GSQTGSQTSNSSIDD41 pKa = 3.46TSASTDD47 pKa = 3.67SNDD50 pKa = 3.18ACSDD54 pKa = 3.53GGDD57 pKa = 4.0CGDD60 pKa = 4.62GGGGCDD66 pKa = 3.43
Molecular weight: 6.52 kDa
Isoelectric point according different methods:
Protein with the highest isoelectric point:
>tr|A0A4R6YAI6|A0A4R6YAI6_9BURK UIT6 family transporter OS=Hydromonas duriensis OX=1527608 GN=DFR44_103103 PE=4 SV=1
MM1 pKa = 7.45KK2 pKa = 9.51RR3 pKa = 11.84TFQPSVVRR11 pKa = 11.84RR12 pKa = 11.84KK13 pKa = 8.57RR14 pKa = 11.84THH16 pKa = 5.82GFRR19 pKa = 11.84ARR21 pKa = 11.84MKK23 pKa = 9.02TRR25 pKa = 11.84GGRR28 pKa = 11.84AVLSARR34 pKa = 11.84RR35 pKa = 11.84AKK37 pKa = 10.51GRR39 pKa = 11.84TRR41 pKa = 11.84LAVV44 pKa = 3.19
MM1 pKa = 7.45KK2 pKa = 9.51RR3 pKa = 11.84TFQPSVVRR11 pKa = 11.84RR12 pKa = 11.84KK13 pKa = 8.57RR14 pKa = 11.84THH16 pKa = 5.82GFRR19 pKa = 11.84ARR21 pKa = 11.84MKK23 pKa = 9.02TRR25 pKa = 11.84GGRR28 pKa = 11.84AVLSARR34 pKa = 11.84RR35 pKa = 11.84AKK37 pKa = 10.51GRR39 pKa = 11.84TRR41 pKa = 11.84LAVV44 pKa = 3.19
Molecular weight: 5.11 kDa
Isoelectric point according different methods:
Peptides (in silico digests for buttom-up proteomics)
Below you can find in silico digests of the whole proteome with Trypsin, Chymotrypsin, Trypsin+LysC, LysN, ArgC proteases suitable for different mass spec machines.| Try ESI |
 |
|---|
| ChTry ESI |
|
|---|
| ArgC ESI |
|
|---|
| LysN ESI |
|
|---|
| TryLysC ESI |
|
|---|
| Try MALDI |
|
|---|
| ChTry MALDI |
|
|---|
| ArgC MALDI |
|
|---|
| LysN MALDI |
|
|---|
| TryLysC MALDI |
|
|---|
| Try LTQ |
|
|---|
| ChTry LTQ |
|
|---|
| ArgC LTQ |
|
|---|
| LysN LTQ |
|
|---|
| TryLysC LTQ |
|
|---|
| Try MSlow |
|
|---|
| ChTry MSlow |
|
|---|
| ArgC MSlow |
|
|---|
| LysN MSlow |
|
|---|
| TryLysC MSlow |
|
|---|
| Try MShigh |
|
|---|
| ChTry MShigh |
|
|---|
| ArgC MShigh |
|
|---|
| LysN MShigh |
|
|---|
| TryLysC MShigh |
|
|---|
General Statistics
Number of major isoforms |
Number of additional isoforms |
Number of all proteins |
Number of amino acids |
Min. Seq. Length |
Max. Seq. Length |
Avg. Seq. Length |
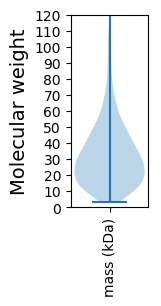
Avg. Mol. Weight |
|---|---|---|---|---|---|---|---|
0 |
707475 |
29 |
3118 |
314.2 |
34.68 |
Amino acid frequency
Ala |
Cys |
Asp |
Glu |
Phe |
Gly |
His |
Ile |
Lys |
Leu |
|---|---|---|---|---|---|---|---|---|---|
10.062 ± 0.068 | 0.974 ± 0.017 |
5.347 ± 0.039 | 5.39 ± 0.053 |
3.954 ± 0.04 | 7.0 ± 0.065 |
2.535 ± 0.032 | 5.712 ± 0.038 |
5.059 ± 0.044 | 10.047 ± 0.086 |
Met |
Asn |
Gln |
Pro |
Arg |
Ser |
Thr |
Val |
Trp |
Tyr |
|---|---|---|---|---|---|---|---|---|---|
2.74 ± 0.027 | 4.243 ± 0.052 |
4.084 ± 0.032 | 4.485 ± 0.038 |
4.927 ± 0.052 | 6.159 ± 0.061 |
5.719 ± 0.06 | 7.37 ± 0.052 |
1.329 ± 0.024 | 2.863 ± 0.027 |
Most of the basic statistics you can see at this page can be downloaded from this CSV file
See this proteome in:

Proteome-pI is available under Creative Commons Attribution-NoDerivs license, for more details see here
| Reference: Kozlowski LP. Proteome-pI 2.0: Proteome Isoelectric Point Database Update. Nucleic Acids Res. 2021, doi: 10.1093/nar/gkab944 | Contact: Lukasz P. Kozlowski |