Agreia sp. Leaf244
Taxonomy: cellular organisms; Bacteria; Terrabacteria group; Actinobacteria; Actinomycetia; Micrococcales; Microbacteriaceae; Agreia; unclassified Agreia
Average proteome isoelectric point is 5.88
Get precalculated fractions of proteins
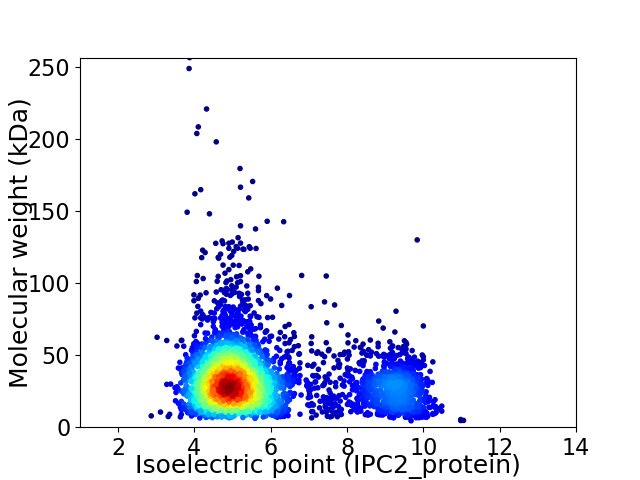
Virtual 2D-PAGE plot for 3657 proteins (isoelectric point calculated using IPC2_protein)
Get csv file with sequences according to given criteria:
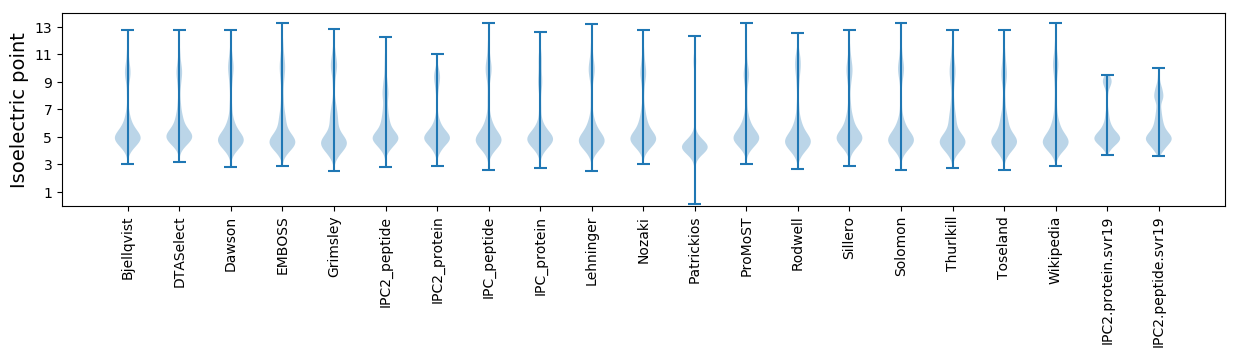
* You can choose from 21 different methods for calculating isoelectric point
Summary statistics related to proteome-wise predictions
Protein with the lowest isoelectric point:
>tr|A0A0S9DW40|A0A0S9DW40_9MICO Lycopene cyclase OS=Agreia sp. Leaf244 OX=1736305 GN=ASF06_07885 PE=4 SV=1
MM1 pKa = 6.41THH3 pKa = 7.11RR4 pKa = 11.84PFLPLVALASAGLIVLAGCSADD26 pKa = 3.33ATGDD30 pKa = 3.6GGSGGASVDD39 pKa = 4.07GEE41 pKa = 4.26ASPAFAIDD49 pKa = 3.73QDD51 pKa = 4.22FPDD54 pKa = 4.96PDD56 pKa = 4.27VITVDD61 pKa = 3.26GQYY64 pKa = 11.13YY65 pKa = 10.74AFATNSRR72 pKa = 11.84AVNLQYY78 pKa = 10.32ATSPDD83 pKa = 3.76LEE85 pKa = 4.45TWSVSLDD92 pKa = 3.47DD93 pKa = 5.65AFPEE97 pKa = 4.21LPAWAEE103 pKa = 4.24TGRR106 pKa = 11.84TWAPDD111 pKa = 3.27VAALPDD117 pKa = 3.7GRR119 pKa = 11.84YY120 pKa = 9.93ALYY123 pKa = 8.52FTAQEE128 pKa = 4.22RR129 pKa = 11.84EE130 pKa = 4.19SGRR133 pKa = 11.84QCIGVAVAAAPTGPFVSDD151 pKa = 3.17APEE154 pKa = 3.93PLICPVGEE162 pKa = 4.53GGAIDD167 pKa = 3.92ASSFVDD173 pKa = 4.34DD174 pKa = 5.0DD175 pKa = 3.77GTRR178 pKa = 11.84YY179 pKa = 9.94LVWKK183 pKa = 10.58NDD185 pKa = 3.68GNCCGLDD192 pKa = 2.86TWLRR196 pKa = 11.84LSTLTADD203 pKa = 3.79GLAVVGEE210 pKa = 4.17PVDD213 pKa = 4.08LVKK216 pKa = 9.78QTEE219 pKa = 4.15EE220 pKa = 4.05WEE222 pKa = 4.46GDD224 pKa = 3.66LVEE227 pKa = 4.74APVIVRR233 pKa = 11.84HH234 pKa = 5.4GDD236 pKa = 3.22EE237 pKa = 3.95YY238 pKa = 11.88ALFYY242 pKa = 10.76SANDD246 pKa = 3.63YY247 pKa = 11.62GGDD250 pKa = 3.85DD251 pKa = 3.67YY252 pKa = 12.28AMGYY256 pKa = 10.8ALAPSIAGPYY266 pKa = 10.12AKK268 pKa = 10.42GDD270 pKa = 3.79GPLLTTATSGGRR282 pKa = 11.84ALGPGGQDD290 pKa = 2.81VVAAPDD296 pKa = 3.69GSDD299 pKa = 3.17RR300 pKa = 11.84IVYY303 pKa = 9.47HH304 pKa = 6.18SWDD307 pKa = 3.02PAYY310 pKa = 10.24SYY312 pKa = 11.2RR313 pKa = 11.84GMIVSPLDD321 pKa = 3.26WSDD324 pKa = 3.28GKK326 pKa = 10.13PVVTPP331 pKa = 4.36
MM1 pKa = 6.41THH3 pKa = 7.11RR4 pKa = 11.84PFLPLVALASAGLIVLAGCSADD26 pKa = 3.33ATGDD30 pKa = 3.6GGSGGASVDD39 pKa = 4.07GEE41 pKa = 4.26ASPAFAIDD49 pKa = 3.73QDD51 pKa = 4.22FPDD54 pKa = 4.96PDD56 pKa = 4.27VITVDD61 pKa = 3.26GQYY64 pKa = 11.13YY65 pKa = 10.74AFATNSRR72 pKa = 11.84AVNLQYY78 pKa = 10.32ATSPDD83 pKa = 3.76LEE85 pKa = 4.45TWSVSLDD92 pKa = 3.47DD93 pKa = 5.65AFPEE97 pKa = 4.21LPAWAEE103 pKa = 4.24TGRR106 pKa = 11.84TWAPDD111 pKa = 3.27VAALPDD117 pKa = 3.7GRR119 pKa = 11.84YY120 pKa = 9.93ALYY123 pKa = 8.52FTAQEE128 pKa = 4.22RR129 pKa = 11.84EE130 pKa = 4.19SGRR133 pKa = 11.84QCIGVAVAAAPTGPFVSDD151 pKa = 3.17APEE154 pKa = 3.93PLICPVGEE162 pKa = 4.53GGAIDD167 pKa = 3.92ASSFVDD173 pKa = 4.34DD174 pKa = 5.0DD175 pKa = 3.77GTRR178 pKa = 11.84YY179 pKa = 9.94LVWKK183 pKa = 10.58NDD185 pKa = 3.68GNCCGLDD192 pKa = 2.86TWLRR196 pKa = 11.84LSTLTADD203 pKa = 3.79GLAVVGEE210 pKa = 4.17PVDD213 pKa = 4.08LVKK216 pKa = 9.78QTEE219 pKa = 4.15EE220 pKa = 4.05WEE222 pKa = 4.46GDD224 pKa = 3.66LVEE227 pKa = 4.74APVIVRR233 pKa = 11.84HH234 pKa = 5.4GDD236 pKa = 3.22EE237 pKa = 3.95YY238 pKa = 11.88ALFYY242 pKa = 10.76SANDD246 pKa = 3.63YY247 pKa = 11.62GGDD250 pKa = 3.85DD251 pKa = 3.67YY252 pKa = 12.28AMGYY256 pKa = 10.8ALAPSIAGPYY266 pKa = 10.12AKK268 pKa = 10.42GDD270 pKa = 3.79GPLLTTATSGGRR282 pKa = 11.84ALGPGGQDD290 pKa = 2.81VVAAPDD296 pKa = 3.69GSDD299 pKa = 3.17RR300 pKa = 11.84IVYY303 pKa = 9.47HH304 pKa = 6.18SWDD307 pKa = 3.02PAYY310 pKa = 10.24SYY312 pKa = 11.2RR313 pKa = 11.84GMIVSPLDD321 pKa = 3.26WSDD324 pKa = 3.28GKK326 pKa = 10.13PVVTPP331 pKa = 4.36
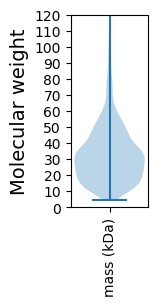
Molecular weight: 34.58 kDa
Isoelectric point according different methods:
Protein with the highest isoelectric point:
>tr|A0A0S9DNU5|A0A0S9DNU5_9MICO Acetamidase OS=Agreia sp. Leaf244 OX=1736305 GN=ASF06_13340 PE=4 SV=1
MM1 pKa = 7.62KK2 pKa = 10.08VRR4 pKa = 11.84NSIKK8 pKa = 10.54SMKK11 pKa = 9.89KK12 pKa = 8.04MPGSQVVRR20 pKa = 11.84RR21 pKa = 11.84RR22 pKa = 11.84GRR24 pKa = 11.84VFVINKK30 pKa = 8.59LNPRR34 pKa = 11.84FKK36 pKa = 10.79ARR38 pKa = 11.84QGG40 pKa = 3.28
MM1 pKa = 7.62KK2 pKa = 10.08VRR4 pKa = 11.84NSIKK8 pKa = 10.54SMKK11 pKa = 9.89KK12 pKa = 8.04MPGSQVVRR20 pKa = 11.84RR21 pKa = 11.84RR22 pKa = 11.84GRR24 pKa = 11.84VFVINKK30 pKa = 8.59LNPRR34 pKa = 11.84FKK36 pKa = 10.79ARR38 pKa = 11.84QGG40 pKa = 3.28
Molecular weight: 4.7 kDa
Isoelectric point according different methods:
Peptides (in silico digests for buttom-up proteomics)
Below you can find in silico digests of the whole proteome with Trypsin, Chymotrypsin, Trypsin+LysC, LysN, ArgC proteases suitable for different mass spec machines.| Try ESI |
 |
|---|
| ChTry ESI |
|
|---|
| ArgC ESI |
|
|---|
| LysN ESI |
|
|---|
| TryLysC ESI |
|
|---|
| Try MALDI |
|
|---|
| ChTry MALDI |
|
|---|
| ArgC MALDI |
|
|---|
| LysN MALDI |
|
|---|
| TryLysC MALDI |
|
|---|
| Try LTQ |
|
|---|
| ChTry LTQ |
|
|---|
| ArgC LTQ |
|
|---|
| LysN LTQ |
|
|---|
| TryLysC LTQ |
|
|---|
| Try MSlow |
|
|---|
| ChTry MSlow |
|
|---|
| ArgC MSlow |
|
|---|
| LysN MSlow |
|
|---|
| TryLysC MSlow |
|
|---|
| Try MShigh |
|
|---|
| ChTry MShigh |
|
|---|
| ArgC MShigh |
|
|---|
| LysN MShigh |
|
|---|
| TryLysC MShigh |
|
|---|
General Statistics
Number of major isoforms |
Number of additional isoforms |
Number of all proteins |
Number of amino acids |
Min. Seq. Length |
Max. Seq. Length |
Avg. Seq. Length |
Avg. Mol. Weight |
|---|---|---|---|---|---|---|---|
0 |
1181973 |
38 |
2527 |
323.2 |
34.56 |
Amino acid frequency
Ala |
Cys |
Asp |
Glu |
Phe |
Gly |
His |
Ile |
Lys |
Leu |
|---|---|---|---|---|---|---|---|---|---|
12.799 ± 0.053 | 0.463 ± 0.009 |
6.313 ± 0.031 | 5.473 ± 0.038 |
3.315 ± 0.027 | 8.716 ± 0.032 |
1.878 ± 0.022 | 4.863 ± 0.031 |
2.095 ± 0.031 | 10.163 ± 0.047 |
Met |
Asn |
Gln |
Pro |
Arg |
Ser |
Thr |
Val |
Trp |
Tyr |
|---|---|---|---|---|---|---|---|---|---|
1.72 ± 0.014 | 2.197 ± 0.018 |
5.274 ± 0.026 | 2.815 ± 0.021 |
6.698 ± 0.046 | 6.522 ± 0.031 |
6.269 ± 0.039 | 8.924 ± 0.037 |
1.44 ± 0.018 | 2.062 ± 0.021 |
Most of the basic statistics you can see at this page can be downloaded from this CSV file
See this proteome in:

Proteome-pI is available under Creative Commons Attribution-NoDerivs license, for more details see here
| Reference: Kozlowski LP. Proteome-pI 2.0: Proteome Isoelectric Point Database Update. Nucleic Acids Res. 2021, doi: 10.1093/nar/gkab944 | Contact: Lukasz P. Kozlowski |