Pantoea phage vB_PagM_LIET2
Taxonomy: Viruses; Duplodnaviria; Heunggongvirae; Uroviricota; Caudoviricetes; Caudovirales; Myoviridae; Lietduovirus; Pantoea virus LIET2
Average proteome isoelectric point is 6.68
Get precalculated fractions of proteins
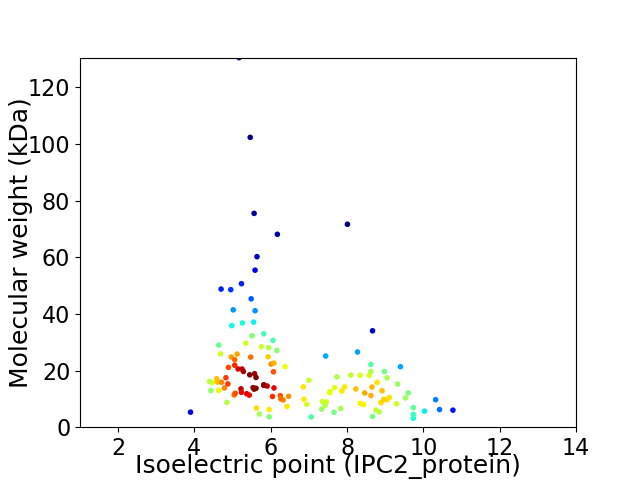
Virtual 2D-PAGE plot for 131 proteins (isoelectric point calculated using IPC2_protein)
Get csv file with sequences according to given criteria:
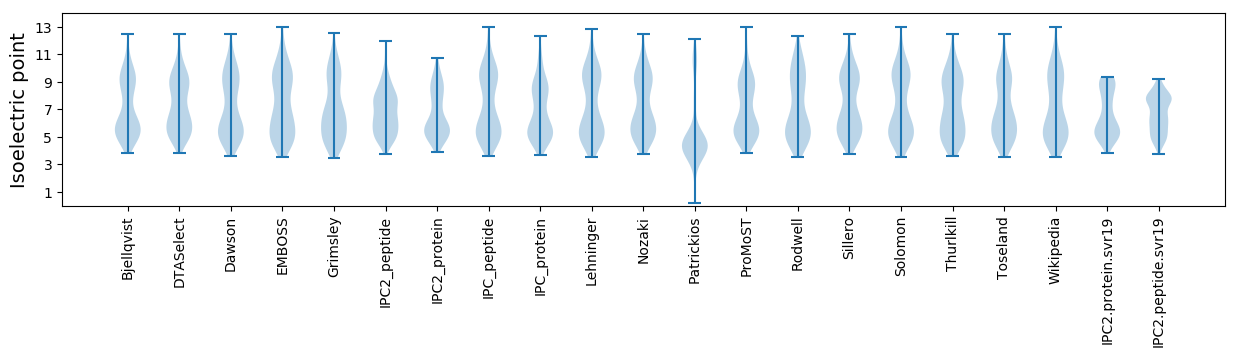
* You can choose from 21 different methods for calculating isoelectric point
Summary statistics related to proteome-wise predictions
Protein with the lowest isoelectric point:
>tr|A0A411AVZ7|A0A411AVZ7_9CAUD Ig-like domain-containing structural protein OS=Pantoea phage vB_PagM_LIET2 OX=2508071 GN=LIET2_gp030 PE=4 SV=1
MM1 pKa = 7.04NQLNEE6 pKa = 4.19EE7 pKa = 4.13QAHH10 pKa = 5.55LLKK13 pKa = 10.11TVMGSMWSDD22 pKa = 3.84FVAEE26 pKa = 4.05AEE28 pKa = 4.33EE29 pKa = 4.2NGFTEE34 pKa = 4.56EE35 pKa = 4.33DD36 pKa = 4.0CEE38 pKa = 4.07ALYY41 pKa = 10.81AAVGGEE47 pKa = 3.98NN48 pKa = 3.37
MM1 pKa = 7.04NQLNEE6 pKa = 4.19EE7 pKa = 4.13QAHH10 pKa = 5.55LLKK13 pKa = 10.11TVMGSMWSDD22 pKa = 3.84FVAEE26 pKa = 4.05AEE28 pKa = 4.33EE29 pKa = 4.2NGFTEE34 pKa = 4.56EE35 pKa = 4.33DD36 pKa = 4.0CEE38 pKa = 4.07ALYY41 pKa = 10.81AAVGGEE47 pKa = 3.98NN48 pKa = 3.37
Molecular weight: 5.31 kDa
Isoelectric point according different methods:
Protein with the highest isoelectric point:
>tr|A0A411AW01|A0A411AW01_9CAUD Uncharacterized protein OS=Pantoea phage vB_PagM_LIET2 OX=2508071 GN=LIET2_gp014 PE=4 SV=1
MM1 pKa = 7.63AGLSRR6 pKa = 11.84LLTMGFFAKK15 pKa = 10.53GFFWTLGKK23 pKa = 10.16LAAFAFTHH31 pKa = 5.64FVVFILALIILGFMAFRR48 pKa = 11.84GRR50 pKa = 11.84RR51 pKa = 11.84KK52 pKa = 9.77KK53 pKa = 10.66
MM1 pKa = 7.63AGLSRR6 pKa = 11.84LLTMGFFAKK15 pKa = 10.53GFFWTLGKK23 pKa = 10.16LAAFAFTHH31 pKa = 5.64FVVFILALIILGFMAFRR48 pKa = 11.84GRR50 pKa = 11.84RR51 pKa = 11.84KK52 pKa = 9.77KK53 pKa = 10.66
Molecular weight: 6.02 kDa
Isoelectric point according different methods:
Peptides (in silico digests for buttom-up proteomics)
Below you can find in silico digests of the whole proteome with Trypsin, Chymotrypsin, Trypsin+LysC, LysN, ArgC proteases suitable for different mass spec machines.| Try ESI |
 |
|---|
| ChTry ESI |
|
|---|
| ArgC ESI |
|
|---|
| LysN ESI |
|
|---|
| TryLysC ESI |
|
|---|
| Try MALDI |
|
|---|
| ChTry MALDI |
|
|---|
| ArgC MALDI |
|
|---|
| LysN MALDI |
|
|---|
| TryLysC MALDI |
|
|---|
| Try LTQ |
|
|---|
| ChTry LTQ |
|
|---|
| ArgC LTQ |
|
|---|
| LysN LTQ |
|
|---|
| TryLysC LTQ |
|
|---|
| Try MSlow |
|
|---|
| ChTry MSlow |
|
|---|
| ArgC MSlow |
|
|---|
| LysN MSlow |
|
|---|
| TryLysC MSlow |
|
|---|
| Try MShigh |
|
|---|
| ChTry MShigh |
|
|---|
| ArgC MShigh |
|
|---|
| LysN MShigh |
|
|---|
| TryLysC MShigh |
|
|---|
General Statistics
Number of major isoforms |
Number of additional isoforms |
Number of all proteins |
Number of amino acids |
Min. Seq. Length |
Max. Seq. Length |
Avg. Seq. Length |
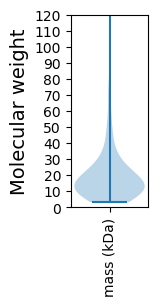
Avg. Mol. Weight |
|---|---|---|---|---|---|---|---|
0 |
24067 |
28 |
1218 |
183.7 |
20.31 |
Amino acid frequency
Ala |
Cys |
Asp |
Glu |
Phe |
Gly |
His |
Ile |
Lys |
Leu |
|---|---|---|---|---|---|---|---|---|---|
10.118 ± 0.323 | 1.209 ± 0.12 |
6.004 ± 0.145 | 5.933 ± 0.246 |
3.74 ± 0.132 | 7.649 ± 0.241 |
1.99 ± 0.125 | 5.95 ± 0.148 |
5.318 ± 0.154 | 7.313 ± 0.202 |
Met |
Asn |
Gln |
Pro |
Arg |
Ser |
Thr |
Val |
Trp |
Tyr |
|---|---|---|---|---|---|---|---|---|---|
3.133 ± 0.123 | 4.355 ± 0.157 |
4.575 ± 0.213 | 3.881 ± 0.171 |
5.834 ± 0.274 | 5.722 ± 0.166 |
6.233 ± 0.261 | 6.652 ± 0.182 |
1.625 ± 0.105 | 2.767 ± 0.127 |
Most of the basic statistics you can see at this page can be downloaded from this CSV file
See this proteome in:

Proteome-pI is available under Creative Commons Attribution-NoDerivs license, for more details see here
| Reference: Kozlowski LP. Proteome-pI 2.0: Proteome Isoelectric Point Database Update. Nucleic Acids Res. 2021, doi: 10.1093/nar/gkab944 | Contact: Lukasz P. Kozlowski |