Mycobacterium phage Phasih
Taxonomy: Viruses; Duplodnaviria; Heunggongvirae; Uroviricota; Caudoviricetes; Caudovirales; Siphoviridae; Cheoctovirus; unclassified Cheoctovirus
Average proteome isoelectric point is 6.0
Get precalculated fractions of proteins
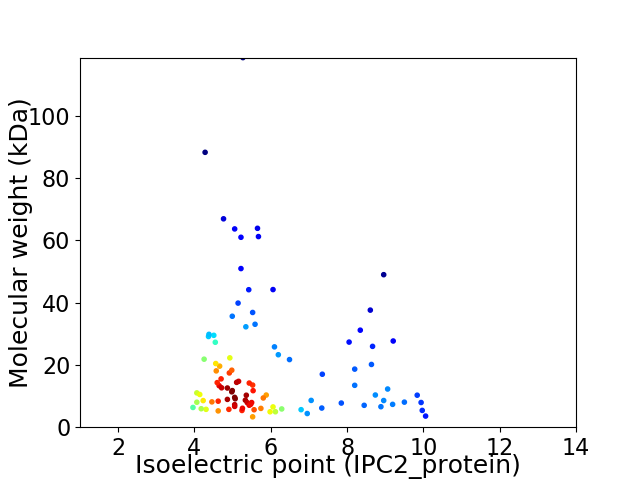
Virtual 2D-PAGE plot for 100 proteins (isoelectric point calculated using IPC2_protein)
Get csv file with sequences according to given criteria:
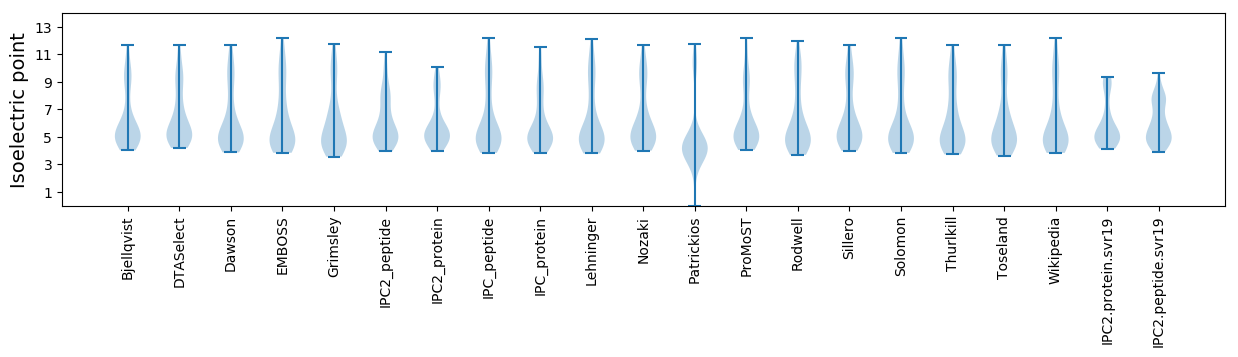
* You can choose from 21 different methods for calculating isoelectric point
Summary statistics related to proteome-wise predictions
Protein with the lowest isoelectric point:
>tr|A0A2D1GH81|A0A2D1GH81_9CAUD Holin OS=Mycobacterium phage Phasih OX=2041544 GN=SEA_PHASIH_33 PE=4 SV=1
MM1 pKa = 7.01TAATDD6 pKa = 3.37RR7 pKa = 11.84YY8 pKa = 8.53EE9 pKa = 4.74AVMCGGCEE17 pKa = 4.02VKK19 pKa = 10.61SDD21 pKa = 3.54DD22 pKa = 4.54VVYY25 pKa = 10.54GMCTACGSVEE35 pKa = 4.12VALMQPTGSYY45 pKa = 7.63PTGHH49 pKa = 6.34GCEE52 pKa = 4.09MCNN55 pKa = 4.11
MM1 pKa = 7.01TAATDD6 pKa = 3.37RR7 pKa = 11.84YY8 pKa = 8.53EE9 pKa = 4.74AVMCGGCEE17 pKa = 4.02VKK19 pKa = 10.61SDD21 pKa = 3.54DD22 pKa = 4.54VVYY25 pKa = 10.54GMCTACGSVEE35 pKa = 4.12VALMQPTGSYY45 pKa = 7.63PTGHH49 pKa = 6.34GCEE52 pKa = 4.09MCNN55 pKa = 4.11
Molecular weight: 5.73 kDa
Isoelectric point according different methods:
Protein with the highest isoelectric point:
>tr|A0A2D1GHP7|A0A2D1GHP7_9CAUD Uncharacterized protein OS=Mycobacterium phage Phasih OX=2041544 GN=SEA_PHASIH_34 PE=4 SV=1
MM1 pKa = 8.05PDD3 pKa = 3.22RR4 pKa = 11.84YY5 pKa = 10.68GDD7 pKa = 3.63PTPEE11 pKa = 3.56PRR13 pKa = 11.84VFVRR17 pKa = 11.84PKK19 pKa = 10.42VNALTVRR26 pKa = 11.84CSWCKK31 pKa = 9.95AGVGSRR37 pKa = 11.84CVVAGTSVVLRR48 pKa = 11.84RR49 pKa = 11.84SSFHH53 pKa = 6.57DD54 pKa = 3.25VRR56 pKa = 11.84VRR58 pKa = 11.84DD59 pKa = 3.96AEE61 pKa = 4.18LAATGALARR70 pKa = 11.84GRR72 pKa = 11.84MSS74 pKa = 3.0
MM1 pKa = 8.05PDD3 pKa = 3.22RR4 pKa = 11.84YY5 pKa = 10.68GDD7 pKa = 3.63PTPEE11 pKa = 3.56PRR13 pKa = 11.84VFVRR17 pKa = 11.84PKK19 pKa = 10.42VNALTVRR26 pKa = 11.84CSWCKK31 pKa = 9.95AGVGSRR37 pKa = 11.84CVVAGTSVVLRR48 pKa = 11.84RR49 pKa = 11.84SSFHH53 pKa = 6.57DD54 pKa = 3.25VRR56 pKa = 11.84VRR58 pKa = 11.84DD59 pKa = 3.96AEE61 pKa = 4.18LAATGALARR70 pKa = 11.84GRR72 pKa = 11.84MSS74 pKa = 3.0
Molecular weight: 8.04 kDa
Isoelectric point according different methods:
Peptides (in silico digests for buttom-up proteomics)
Below you can find in silico digests of the whole proteome with Trypsin, Chymotrypsin, Trypsin+LysC, LysN, ArgC proteases suitable for different mass spec machines.| Try ESI |
 |
|---|
| ChTry ESI |
|
|---|
| ArgC ESI |
|
|---|
| LysN ESI |
|
|---|
| TryLysC ESI |
|
|---|
| Try MALDI |
|
|---|
| ChTry MALDI |
|
|---|
| ArgC MALDI |
|
|---|
| LysN MALDI |
|
|---|
| TryLysC MALDI |
|
|---|
| Try LTQ |
|
|---|
| ChTry LTQ |
|
|---|
| ArgC LTQ |
|
|---|
| LysN LTQ |
|
|---|
| TryLysC LTQ |
|
|---|
| Try MSlow |
|
|---|
| ChTry MSlow |
|
|---|
| ArgC MSlow |
|
|---|
| LysN MSlow |
|
|---|
| TryLysC MSlow |
|
|---|
| Try MShigh |
|
|---|
| ChTry MShigh |
|
|---|
| ArgC MShigh |
|
|---|
| LysN MShigh |
|
|---|
| TryLysC MShigh |
|
|---|
General Statistics
Number of major isoforms |
Number of additional isoforms |
Number of all proteins |
Number of amino acids |
Min. Seq. Length |
Max. Seq. Length |
Avg. Seq. Length |
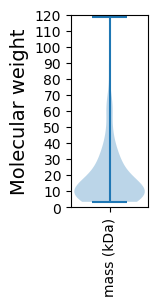
Avg. Mol. Weight |
|---|---|---|---|---|---|---|---|
0 |
17839 |
30 |
1161 |
178.4 |
19.55 |
Amino acid frequency
Ala |
Cys |
Asp |
Glu |
Phe |
Gly |
His |
Ile |
Lys |
Leu |
|---|---|---|---|---|---|---|---|---|---|
10.27 ± 0.443 | 1.34 ± 0.179 |
6.604 ± 0.248 | 5.959 ± 0.325 |
2.853 ± 0.196 | 8.739 ± 0.555 |
2.354 ± 0.22 | 4.367 ± 0.186 |
3.47 ± 0.231 | 7.265 ± 0.221 |
Met |
Asn |
Gln |
Pro |
Arg |
Ser |
Thr |
Val |
Trp |
Tyr |
|---|---|---|---|---|---|---|---|---|---|
2.231 ± 0.141 | 3.453 ± 0.18 |
6.116 ± 0.213 | 3.425 ± 0.188 |
6.917 ± 0.406 | 5.785 ± 0.276 |
6.665 ± 0.237 | 7.349 ± 0.268 |
2.248 ± 0.141 | 2.59 ± 0.151 |
Most of the basic statistics you can see at this page can be downloaded from this CSV file
See this proteome in:

Proteome-pI is available under Creative Commons Attribution-NoDerivs license, for more details see here
| Reference: Kozlowski LP. Proteome-pI 2.0: Proteome Isoelectric Point Database Update. Nucleic Acids Res. 2021, doi: 10.1093/nar/gkab944 | Contact: Lukasz P. Kozlowski |