Pseudomonas phage phi15
Taxonomy: Viruses; Duplodnaviria; Heunggongvirae; Uroviricota; Caudoviricetes; Caudovirales; Autographiviridae; Studiervirinae; Troedvirus; Pseudomonas virus Phi15
Average proteome isoelectric point is 6.59
Get precalculated fractions of proteins
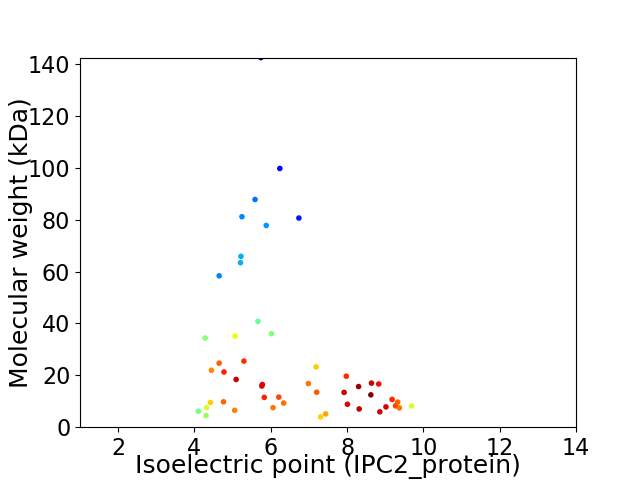
Virtual 2D-PAGE plot for 50 proteins (isoelectric point calculated using IPC2_protein)
Get csv file with sequences according to given criteria:
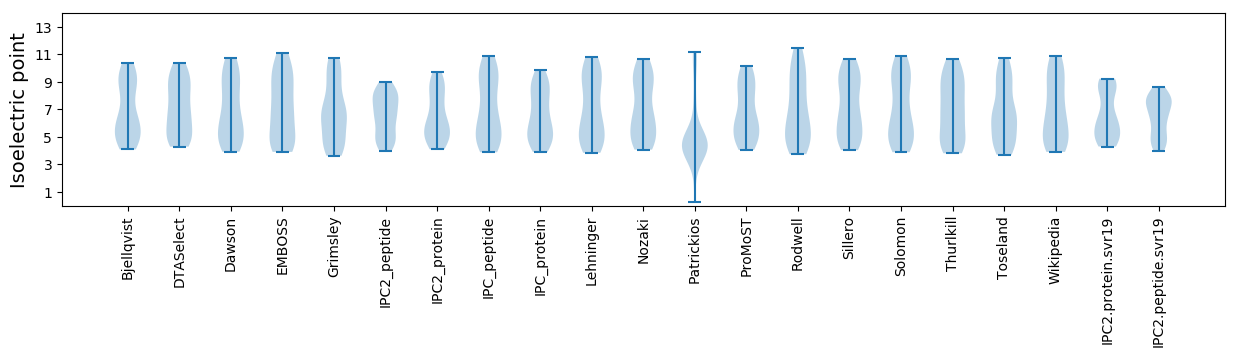
* You can choose from 21 different methods for calculating isoelectric point
Summary statistics related to proteome-wise predictions
Protein with the lowest isoelectric point:
>tr|F0V6Z9|F0V6Z9_9CAUD Virion structural protein OS=Pseudomonas phage phi15 OX=988656 PE=4 SV=1
MM1 pKa = 7.09TLDD4 pKa = 3.41VGASKK9 pKa = 11.08ALTVAEE15 pKa = 4.25GVEE18 pKa = 4.78VVWSSSDD25 pKa = 3.61DD26 pKa = 3.65LVATVTDD33 pKa = 4.17GLVSAVSSGKK43 pKa = 10.65ANVTATYY50 pKa = 11.08GDD52 pKa = 3.8LTATCVVTVRR62 pKa = 4.17
MM1 pKa = 7.09TLDD4 pKa = 3.41VGASKK9 pKa = 11.08ALTVAEE15 pKa = 4.25GVEE18 pKa = 4.78VVWSSSDD25 pKa = 3.61DD26 pKa = 3.65LVATVTDD33 pKa = 4.17GLVSAVSSGKK43 pKa = 10.65ANVTATYY50 pKa = 11.08GDD52 pKa = 3.8LTATCVVTVRR62 pKa = 4.17
Molecular weight: 6.19 kDa
Isoelectric point according different methods:
Protein with the highest isoelectric point:
>tr|F0V710|F0V710_9CAUD Terminase large subunit OS=Pseudomonas phage phi15 OX=988656 PE=3 SV=1
MM1 pKa = 7.5FKK3 pKa = 10.66QNSTKK8 pKa = 10.6RR9 pKa = 11.84PVTGLKK15 pKa = 9.43IRR17 pKa = 11.84RR18 pKa = 11.84GLRR21 pKa = 11.84ALPVALLIALLSLAYY36 pKa = 10.09GCASKK41 pKa = 9.92PQTPPEE47 pKa = 4.4PKK49 pKa = 10.06SKK51 pKa = 9.42VTIEE55 pKa = 3.73ASLMVKK61 pKa = 10.37PNYY64 pKa = 8.05TEE66 pKa = 4.72RR67 pKa = 11.84LLKK70 pKa = 10.6LLSEE74 pKa = 4.62
MM1 pKa = 7.5FKK3 pKa = 10.66QNSTKK8 pKa = 10.6RR9 pKa = 11.84PVTGLKK15 pKa = 9.43IRR17 pKa = 11.84RR18 pKa = 11.84GLRR21 pKa = 11.84ALPVALLIALLSLAYY36 pKa = 10.09GCASKK41 pKa = 9.92PQTPPEE47 pKa = 4.4PKK49 pKa = 10.06SKK51 pKa = 9.42VTIEE55 pKa = 3.73ASLMVKK61 pKa = 10.37PNYY64 pKa = 8.05TEE66 pKa = 4.72RR67 pKa = 11.84LLKK70 pKa = 10.6LLSEE74 pKa = 4.62
Molecular weight: 8.18 kDa
Isoelectric point according different methods:
Peptides (in silico digests for buttom-up proteomics)
Below you can find in silico digests of the whole proteome with Trypsin, Chymotrypsin, Trypsin+LysC, LysN, ArgC proteases suitable for different mass spec machines.| Try ESI |
 |
|---|
| ChTry ESI |
|
|---|
| ArgC ESI |
|
|---|
| LysN ESI |
|
|---|
| TryLysC ESI |
|
|---|
| Try MALDI |
|
|---|
| ChTry MALDI |
|
|---|
| ArgC MALDI |
|
|---|
| LysN MALDI |
|
|---|
| TryLysC MALDI |
|
|---|
| Try LTQ |
|
|---|
| ChTry LTQ |
|
|---|
| ArgC LTQ |
|
|---|
| LysN LTQ |
|
|---|
| TryLysC LTQ |
|
|---|
| Try MSlow |
|
|---|
| ChTry MSlow |
|
|---|
| ArgC MSlow |
|
|---|
| LysN MSlow |
|
|---|
| TryLysC MSlow |
|
|---|
| Try MShigh |
|
|---|
| ChTry MShigh |
|
|---|
| ArgC MShigh |
|
|---|
| LysN MShigh |
|
|---|
| TryLysC MShigh |
|
|---|
General Statistics
Number of major isoforms |
Number of additional isoforms |
Number of all proteins |
Number of amino acids |
Min. Seq. Length |
Max. Seq. Length |
Avg. Seq. Length |
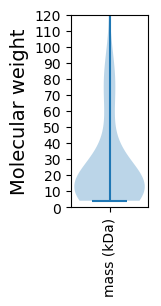
Avg. Mol. Weight |
|---|---|---|---|---|---|---|---|
0 |
12311 |
32 |
1326 |
246.2 |
27.27 |
Amino acid frequency
Ala |
Cys |
Asp |
Glu |
Phe |
Gly |
His |
Ile |
Lys |
Leu |
|---|---|---|---|---|---|---|---|---|---|
9.829 ± 0.517 | 0.967 ± 0.147 |
6.222 ± 0.247 | 6.921 ± 0.41 |
3.704 ± 0.164 | 8.237 ± 0.337 |
2.071 ± 0.205 | 4.679 ± 0.164 |
5.816 ± 0.429 | 8.237 ± 0.291 |
Met |
Asn |
Gln |
Pro |
Arg |
Ser |
Thr |
Val |
Trp |
Tyr |
|---|---|---|---|---|---|---|---|---|---|
2.754 ± 0.205 | 4.045 ± 0.272 |
3.931 ± 0.156 | 4.208 ± 0.354 |
5.922 ± 0.231 | 5.524 ± 0.291 |
5.613 ± 0.325 | 6.961 ± 0.325 |
1.462 ± 0.145 | 2.9 ± 0.175 |
Most of the basic statistics you can see at this page can be downloaded from this CSV file
See this proteome in:

Proteome-pI is available under Creative Commons Attribution-NoDerivs license, for more details see here
| Reference: Kozlowski LP. Proteome-pI 2.0: Proteome Isoelectric Point Database Update. Nucleic Acids Res. 2021, doi: 10.1093/nar/gkab944 | Contact: Lukasz P. Kozlowski |