Pseudomonas cremoricolorata
Taxonomy: cellular organisms; Bacteria; Proteobacteria; Gammaproteobacteria; Pseudomonadales; Pseudomonadaceae;
Average proteome isoelectric point is 6.45
Get precalculated fractions of proteins
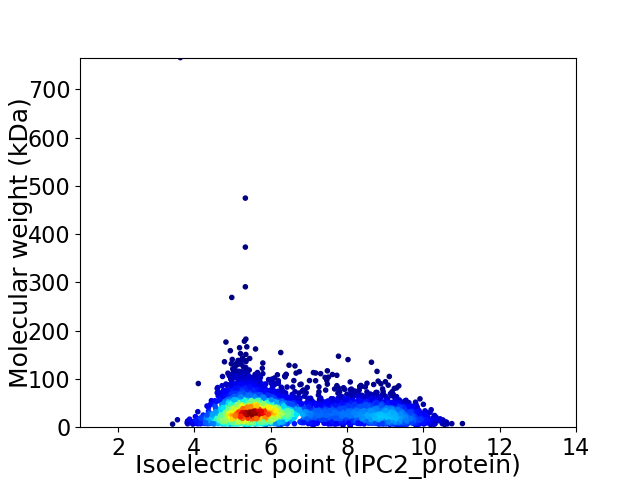
Virtual 2D-PAGE plot for 4020 proteins (isoelectric point calculated using IPC2_protein)
Get csv file with sequences according to given criteria:
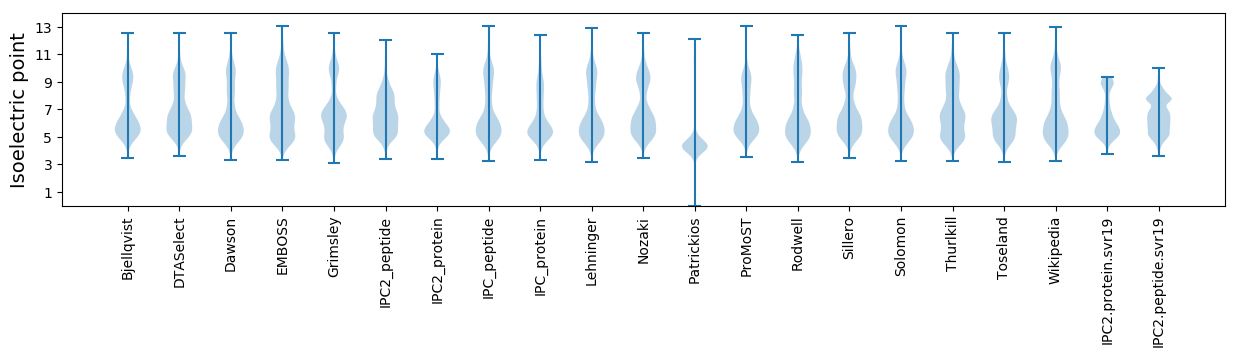
* You can choose from 21 different methods for calculating isoelectric point
Summary statistics related to proteome-wise predictions
Protein with the lowest isoelectric point:
>tr|A0A089WR78|A0A089WR78_9PSED DNA polymerase III subunit chi OS=Pseudomonas cremoricolorata OX=157783 GN=LK03_10250 PE=4 SV=1
MM1 pKa = 6.73QRR3 pKa = 11.84IYY5 pKa = 10.78EE6 pKa = 4.28PEE8 pKa = 3.87NLMEE12 pKa = 4.3AQMLVGMLANEE23 pKa = 4.74GIEE26 pKa = 4.04VFLIGRR32 pKa = 11.84DD33 pKa = 3.53LVGAAGEE40 pKa = 4.29LPIQGLLGLAVADD53 pKa = 4.25EE54 pKa = 4.19QAGYY58 pKa = 10.82ARR60 pKa = 11.84QLIDD64 pKa = 4.61AYY66 pKa = 11.08NAAQPVLGDD75 pKa = 4.3EE76 pKa = 4.46PDD78 pKa = 3.84SYY80 pKa = 11.23PGTLICC86 pKa = 6.31
MM1 pKa = 6.73QRR3 pKa = 11.84IYY5 pKa = 10.78EE6 pKa = 4.28PEE8 pKa = 3.87NLMEE12 pKa = 4.3AQMLVGMLANEE23 pKa = 4.74GIEE26 pKa = 4.04VFLIGRR32 pKa = 11.84DD33 pKa = 3.53LVGAAGEE40 pKa = 4.29LPIQGLLGLAVADD53 pKa = 4.25EE54 pKa = 4.19QAGYY58 pKa = 10.82ARR60 pKa = 11.84QLIDD64 pKa = 4.61AYY66 pKa = 11.08NAAQPVLGDD75 pKa = 4.3EE76 pKa = 4.46PDD78 pKa = 3.84SYY80 pKa = 11.23PGTLICC86 pKa = 6.31
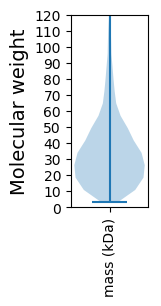
Molecular weight: 9.19 kDa
Isoelectric point according different methods:
Protein with the highest isoelectric point:
>tr|A0A089WPX1|A0A089WPX1_9PSED 30S ribosomal protein S17 OS=Pseudomonas cremoricolorata OX=157783 GN=rpsQ PE=3 SV=1
MM1 pKa = 7.38HH2 pKa = 7.55FGRR5 pKa = 11.84RR6 pKa = 11.84LQAFRR11 pKa = 11.84LWFNPKK17 pKa = 8.39RR18 pKa = 11.84RR19 pKa = 11.84RR20 pKa = 11.84WAGLTLIAMAVAAMFLNPGSRR41 pKa = 11.84WGLLLGAGIYY51 pKa = 9.65WFVTSLPPFIGGRR64 pKa = 11.84RR65 pKa = 3.48
MM1 pKa = 7.38HH2 pKa = 7.55FGRR5 pKa = 11.84RR6 pKa = 11.84LQAFRR11 pKa = 11.84LWFNPKK17 pKa = 8.39RR18 pKa = 11.84RR19 pKa = 11.84RR20 pKa = 11.84WAGLTLIAMAVAAMFLNPGSRR41 pKa = 11.84WGLLLGAGIYY51 pKa = 9.65WFVTSLPPFIGGRR64 pKa = 11.84RR65 pKa = 3.48
Molecular weight: 7.51 kDa
Isoelectric point according different methods:
Peptides (in silico digests for buttom-up proteomics)
Below you can find in silico digests of the whole proteome with Trypsin, Chymotrypsin, Trypsin+LysC, LysN, ArgC proteases suitable for different mass spec machines.| Try ESI |
 |
|---|
| ChTry ESI |
|
|---|
| ArgC ESI |
|
|---|
| LysN ESI |
|
|---|
| TryLysC ESI |
|
|---|
| Try MALDI |
|
|---|
| ChTry MALDI |
|
|---|
| ArgC MALDI |
|
|---|
| LysN MALDI |
|
|---|
| TryLysC MALDI |
|
|---|
| Try LTQ |
|
|---|
| ChTry LTQ |
|
|---|
| ArgC LTQ |
|
|---|
| LysN LTQ |
|
|---|
| TryLysC LTQ |
|
|---|
| Try MSlow |
|
|---|
| ChTry MSlow |
|
|---|
| ArgC MSlow |
|
|---|
| LysN MSlow |
|
|---|
| TryLysC MSlow |
|
|---|
| Try MShigh |
|
|---|
| ChTry MShigh |
|
|---|
| ArgC MShigh |
|
|---|
| LysN MShigh |
|
|---|
| TryLysC MShigh |
|
|---|
General Statistics
Number of major isoforms |
Number of additional isoforms |
Number of all proteins |
Number of amino acids |
Min. Seq. Length |
Max. Seq. Length |
Avg. Seq. Length |
Avg. Mol. Weight |
|---|---|---|---|---|---|---|---|
0 |
1324866 |
29 |
7790 |
329.6 |
36.1 |
Amino acid frequency
Ala |
Cys |
Asp |
Glu |
Phe |
Gly |
His |
Ile |
Lys |
Leu |
|---|---|---|---|---|---|---|---|---|---|
11.477 ± 0.041 | 0.992 ± 0.014 |
5.424 ± 0.03 | 5.586 ± 0.035 |
3.479 ± 0.023 | 7.999 ± 0.038 |
2.377 ± 0.022 | 4.464 ± 0.036 |
3.111 ± 0.037 | 11.982 ± 0.059 |
Met |
Asn |
Gln |
Pro |
Arg |
Ser |
Thr |
Val |
Trp |
Tyr |
|---|---|---|---|---|---|---|---|---|---|
2.205 ± 0.02 | 2.798 ± 0.022 |
4.869 ± 0.031 | 4.926 ± 0.034 |
6.771 ± 0.042 | 5.737 ± 0.031 |
4.708 ± 0.036 | 7.168 ± 0.038 |
1.439 ± 0.019 | 2.487 ± 0.025 |
Most of the basic statistics you can see at this page can be downloaded from this CSV file
See this proteome in:

Proteome-pI is available under Creative Commons Attribution-NoDerivs license, for more details see here
| Reference: Kozlowski LP. Proteome-pI 2.0: Proteome Isoelectric Point Database Update. Nucleic Acids Res. 2021, doi: 10.1093/nar/gkab944 | Contact: Lukasz P. Kozlowski |