Hubei virga-like virus 7
Taxonomy: Viruses; Riboviria; unclassified Riboviria; unclassified RNA viruses ShiM-2016
Average proteome isoelectric point is 6.91
Get precalculated fractions of proteins
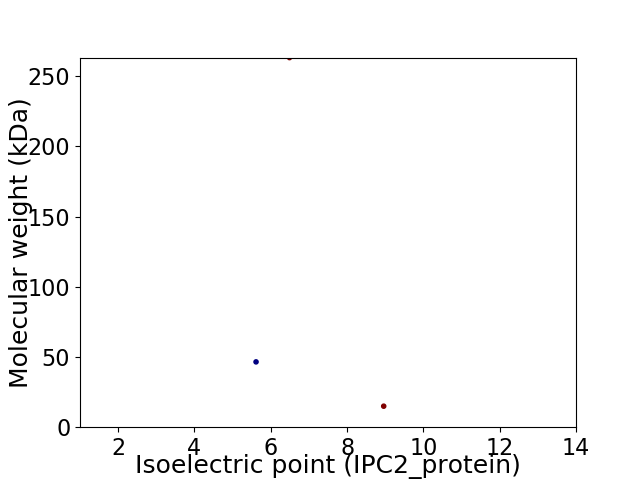
Virtual 2D-PAGE plot for 3 proteins (isoelectric point calculated using IPC2_protein)
Get csv file with sequences according to given criteria:
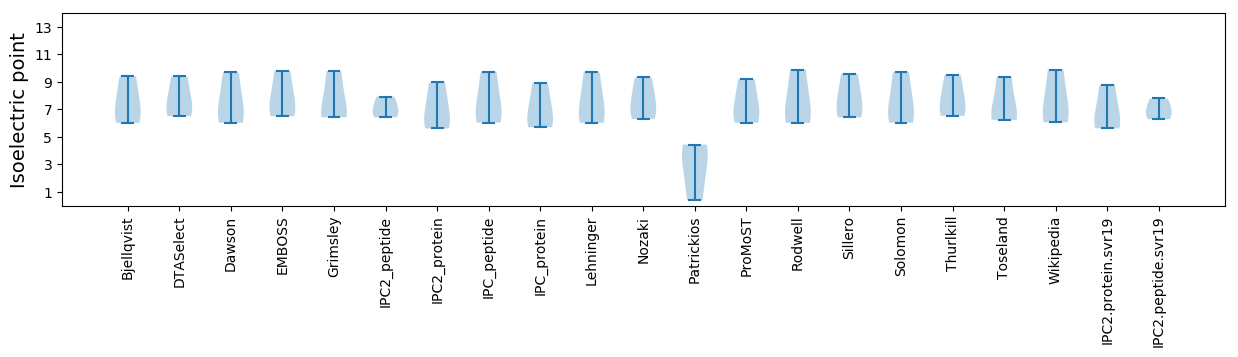
* You can choose from 21 different methods for calculating isoelectric point
Summary statistics related to proteome-wise predictions
Protein with the lowest isoelectric point:
>tr|A0A1L3KJY6|A0A1L3KJY6_9VIRU Uncharacterized protein OS=Hubei virga-like virus 7 OX=1923340 PE=4 SV=1
MM1 pKa = 7.84LYY3 pKa = 10.57LIVISALFCISSTQFVASNFEE24 pKa = 4.07LSLGEE29 pKa = 4.05IAEE32 pKa = 4.3LTDD35 pKa = 3.63GNVVFQHH42 pKa = 6.2EE43 pKa = 4.21FDD45 pKa = 4.11ILDD48 pKa = 3.38KK49 pKa = 10.76HH50 pKa = 6.81LSSEE54 pKa = 4.2VQIYY58 pKa = 7.67STNFYY63 pKa = 10.66SHH65 pKa = 7.16IVGANCPVGFHH76 pKa = 6.25RR77 pKa = 11.84QDD79 pKa = 2.95INHH82 pKa = 5.73YY83 pKa = 7.76TFSDD87 pKa = 3.35IFACIYY93 pKa = 10.33HH94 pKa = 7.48GYY96 pKa = 8.05TDD98 pKa = 4.07IYY100 pKa = 10.15SLPVKK105 pKa = 10.19YY106 pKa = 9.69RR107 pKa = 11.84AYY109 pKa = 10.83SLRR112 pKa = 11.84LTSNVIDD119 pKa = 4.18RR120 pKa = 11.84YY121 pKa = 9.74STIQYY126 pKa = 10.38INLHH130 pKa = 5.82EE131 pKa = 4.3FLVLKK136 pKa = 10.7NDD138 pKa = 3.15TGYY141 pKa = 11.07YY142 pKa = 9.93LSTRR146 pKa = 11.84FCFNEE151 pKa = 4.2YY152 pKa = 8.89PWKK155 pKa = 10.55DD156 pKa = 3.16INGTIQPHH164 pKa = 6.72LYY166 pKa = 10.35FEE168 pKa = 4.24NHH170 pKa = 5.5DD171 pKa = 4.11TFVKK175 pKa = 10.08FYY177 pKa = 11.09VSNSCLLRR185 pKa = 11.84YY186 pKa = 7.65LTTDD190 pKa = 3.46AEE192 pKa = 4.32HH193 pKa = 5.6LTYY196 pKa = 10.77YY197 pKa = 9.95IFSQIPSLFDD207 pKa = 4.52LEE209 pKa = 4.96VKK211 pKa = 9.58TPNSAVDD218 pKa = 3.78FFRR221 pKa = 11.84VGFVKK226 pKa = 8.79YY227 pKa = 9.77HH228 pKa = 6.2WLHH231 pKa = 6.05HH232 pKa = 5.4TLSPGDD238 pKa = 4.48LPYY241 pKa = 9.96MDD243 pKa = 5.4YY244 pKa = 11.24NATHH248 pKa = 7.5SITKK252 pKa = 8.86HH253 pKa = 5.78CYY255 pKa = 8.09SVEE258 pKa = 4.1YY259 pKa = 10.02CVAVYY264 pKa = 10.47YY265 pKa = 9.33PVQRR269 pKa = 11.84LFTTIAIQSAHH280 pKa = 6.52ANSFVHH286 pKa = 6.31SLTHH290 pKa = 7.29AILSILKK297 pKa = 9.29PILVEE302 pKa = 3.96ILSLMSFLFGSIIDD316 pKa = 5.1LIFSSEE322 pKa = 4.26FIDD325 pKa = 4.69LYY327 pKa = 11.67KK328 pKa = 11.0LFFDD332 pKa = 4.25NFIKK336 pKa = 10.62ALHH339 pKa = 6.21QILTFIFTNFRR350 pKa = 11.84LLIYY354 pKa = 10.53YY355 pKa = 10.35LLTNHH360 pKa = 7.13IYY362 pKa = 10.78FSMGLFLFLLIYY374 pKa = 9.9IRR376 pKa = 11.84YY377 pKa = 8.85GMLVYY382 pKa = 10.77SFIFVLLLSSLVRR395 pKa = 11.84LDD397 pKa = 3.33
MM1 pKa = 7.84LYY3 pKa = 10.57LIVISALFCISSTQFVASNFEE24 pKa = 4.07LSLGEE29 pKa = 4.05IAEE32 pKa = 4.3LTDD35 pKa = 3.63GNVVFQHH42 pKa = 6.2EE43 pKa = 4.21FDD45 pKa = 4.11ILDD48 pKa = 3.38KK49 pKa = 10.76HH50 pKa = 6.81LSSEE54 pKa = 4.2VQIYY58 pKa = 7.67STNFYY63 pKa = 10.66SHH65 pKa = 7.16IVGANCPVGFHH76 pKa = 6.25RR77 pKa = 11.84QDD79 pKa = 2.95INHH82 pKa = 5.73YY83 pKa = 7.76TFSDD87 pKa = 3.35IFACIYY93 pKa = 10.33HH94 pKa = 7.48GYY96 pKa = 8.05TDD98 pKa = 4.07IYY100 pKa = 10.15SLPVKK105 pKa = 10.19YY106 pKa = 9.69RR107 pKa = 11.84AYY109 pKa = 10.83SLRR112 pKa = 11.84LTSNVIDD119 pKa = 4.18RR120 pKa = 11.84YY121 pKa = 9.74STIQYY126 pKa = 10.38INLHH130 pKa = 5.82EE131 pKa = 4.3FLVLKK136 pKa = 10.7NDD138 pKa = 3.15TGYY141 pKa = 11.07YY142 pKa = 9.93LSTRR146 pKa = 11.84FCFNEE151 pKa = 4.2YY152 pKa = 8.89PWKK155 pKa = 10.55DD156 pKa = 3.16INGTIQPHH164 pKa = 6.72LYY166 pKa = 10.35FEE168 pKa = 4.24NHH170 pKa = 5.5DD171 pKa = 4.11TFVKK175 pKa = 10.08FYY177 pKa = 11.09VSNSCLLRR185 pKa = 11.84YY186 pKa = 7.65LTTDD190 pKa = 3.46AEE192 pKa = 4.32HH193 pKa = 5.6LTYY196 pKa = 10.77YY197 pKa = 9.95IFSQIPSLFDD207 pKa = 4.52LEE209 pKa = 4.96VKK211 pKa = 9.58TPNSAVDD218 pKa = 3.78FFRR221 pKa = 11.84VGFVKK226 pKa = 8.79YY227 pKa = 9.77HH228 pKa = 6.2WLHH231 pKa = 6.05HH232 pKa = 5.4TLSPGDD238 pKa = 4.48LPYY241 pKa = 9.96MDD243 pKa = 5.4YY244 pKa = 11.24NATHH248 pKa = 7.5SITKK252 pKa = 8.86HH253 pKa = 5.78CYY255 pKa = 8.09SVEE258 pKa = 4.1YY259 pKa = 10.02CVAVYY264 pKa = 10.47YY265 pKa = 9.33PVQRR269 pKa = 11.84LFTTIAIQSAHH280 pKa = 6.52ANSFVHH286 pKa = 6.31SLTHH290 pKa = 7.29AILSILKK297 pKa = 9.29PILVEE302 pKa = 3.96ILSLMSFLFGSIIDD316 pKa = 5.1LIFSSEE322 pKa = 4.26FIDD325 pKa = 4.69LYY327 pKa = 11.67KK328 pKa = 11.0LFFDD332 pKa = 4.25NFIKK336 pKa = 10.62ALHH339 pKa = 6.21QILTFIFTNFRR350 pKa = 11.84LLIYY354 pKa = 10.53YY355 pKa = 10.35LLTNHH360 pKa = 7.13IYY362 pKa = 10.78FSMGLFLFLLIYY374 pKa = 9.9IRR376 pKa = 11.84YY377 pKa = 8.85GMLVYY382 pKa = 10.77SFIFVLLLSSLVRR395 pKa = 11.84LDD397 pKa = 3.33
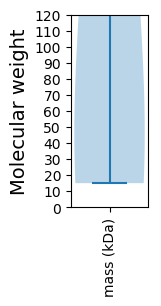
Molecular weight: 46.5 kDa
Isoelectric point according different methods:
Protein with the highest isoelectric point:
>tr|A0A1L3KJY6|A0A1L3KJY6_9VIRU Uncharacterized protein OS=Hubei virga-like virus 7 OX=1923340 PE=4 SV=1
MM1 pKa = 7.54PWLIIIMLFYY11 pKa = 11.23YY12 pKa = 10.93LLTLFYY18 pKa = 11.05FNGNVMDD25 pKa = 4.0VEE27 pKa = 4.44HH28 pKa = 6.61VKK30 pKa = 10.69LFKK33 pKa = 10.36FANDD37 pKa = 4.37SIHH40 pKa = 6.05KK41 pKa = 10.35QIDD44 pKa = 3.63IVKK47 pKa = 9.91HH48 pKa = 5.3VYY50 pKa = 8.66TLQTRR55 pKa = 11.84PYY57 pKa = 8.89ILWSTDD63 pKa = 3.29VQWNPKK69 pKa = 10.13KK70 pKa = 10.48FVTVDD75 pKa = 3.24KK76 pKa = 10.89YY77 pKa = 10.81RR78 pKa = 11.84VSVTDD83 pKa = 3.36AGLYY87 pKa = 10.64GILNEE92 pKa = 4.32GAQKK96 pKa = 10.82NFNSSDD102 pKa = 3.23YY103 pKa = 11.12LRR105 pKa = 11.84FVKK108 pKa = 10.34PYY110 pKa = 10.43GLKK113 pKa = 10.48LDD115 pKa = 3.79VTKK118 pKa = 11.06SRR120 pKa = 11.84ITLLSLSS127 pKa = 3.91
MM1 pKa = 7.54PWLIIIMLFYY11 pKa = 11.23YY12 pKa = 10.93LLTLFYY18 pKa = 11.05FNGNVMDD25 pKa = 4.0VEE27 pKa = 4.44HH28 pKa = 6.61VKK30 pKa = 10.69LFKK33 pKa = 10.36FANDD37 pKa = 4.37SIHH40 pKa = 6.05KK41 pKa = 10.35QIDD44 pKa = 3.63IVKK47 pKa = 9.91HH48 pKa = 5.3VYY50 pKa = 8.66TLQTRR55 pKa = 11.84PYY57 pKa = 8.89ILWSTDD63 pKa = 3.29VQWNPKK69 pKa = 10.13KK70 pKa = 10.48FVTVDD75 pKa = 3.24KK76 pKa = 10.89YY77 pKa = 10.81RR78 pKa = 11.84VSVTDD83 pKa = 3.36AGLYY87 pKa = 10.64GILNEE92 pKa = 4.32GAQKK96 pKa = 10.82NFNSSDD102 pKa = 3.23YY103 pKa = 11.12LRR105 pKa = 11.84FVKK108 pKa = 10.34PYY110 pKa = 10.43GLKK113 pKa = 10.48LDD115 pKa = 3.79VTKK118 pKa = 11.06SRR120 pKa = 11.84ITLLSLSS127 pKa = 3.91
Molecular weight: 14.96 kDa
Isoelectric point according different methods:
Peptides (in silico digests for buttom-up proteomics)
Below you can find in silico digests of the whole proteome with Trypsin, Chymotrypsin, Trypsin+LysC, LysN, ArgC proteases suitable for different mass spec machines.| Try ESI |
 |
|---|
| ChTry ESI |
|
|---|
| ArgC ESI |
|
|---|
| LysN ESI |
|
|---|
| TryLysC ESI |
|
|---|
| Try MALDI |
|
|---|
| ChTry MALDI |
|
|---|
| ArgC MALDI |
|
|---|
| LysN MALDI |
|
|---|
| TryLysC MALDI |
|
|---|
| Try LTQ |
|
|---|
| ChTry LTQ |
|
|---|
| ArgC LTQ |
|
|---|
| LysN LTQ |
|
|---|
| TryLysC LTQ |
|
|---|
| Try MSlow |
|
|---|
| ChTry MSlow |
|
|---|
| ArgC MSlow |
|
|---|
| LysN MSlow |
|
|---|
| TryLysC MSlow |
|
|---|
| Try MShigh |
|
|---|
| ChTry MShigh |
|
|---|
| ArgC MShigh |
|
|---|
| LysN MShigh |
|
|---|
| TryLysC MShigh |
|
|---|
General Statistics
Number of major isoforms |
Number of additional isoforms |
Number of all proteins |
Number of amino acids |
Min. Seq. Length |
Max. Seq. Length |
Avg. Seq. Length |
Avg. Mol. Weight |
|---|---|---|---|---|---|---|---|
0 |
2795 |
127 |
2271 |
931.7 |
108.2 |
Amino acid frequency
Ala |
Cys |
Asp |
Glu |
Phe |
Gly |
His |
Ile |
Lys |
Leu |
|---|---|---|---|---|---|---|---|---|---|
3.399 ± 0.254 | 2.361 ± 0.654 |
5.76 ± 0.344 | 4.651 ± 0.984 |
5.546 ± 1.413 | 2.755 ± 0.321 |
3.435 ± 0.573 | 8.229 ± 0.422 |
6.905 ± 1.447 | 9.445 ± 1.668 |
Met |
Asn |
Gln |
Pro |
Arg |
Ser |
Thr |
Val |
Trp |
Tyr |
|---|---|---|---|---|---|---|---|---|---|
2.326 ± 0.382 | 7.478 ± 1.259 |
3.327 ± 0.304 | 2.97 ± 0.158 |
3.148 ± 0.136 | 8.193 ± 0.488 |
6.047 ± 0.061 | 6.941 ± 0.593 |
0.501 ± 0.448 | 6.583 ± 0.662 |
Most of the basic statistics you can see at this page can be downloaded from this CSV file
See this proteome in:

Proteome-pI is available under Creative Commons Attribution-NoDerivs license, for more details see here
| Reference: Kozlowski LP. Proteome-pI 2.0: Proteome Isoelectric Point Database Update. Nucleic Acids Res. 2021, doi: 10.1093/nar/gkab944 | Contact: Lukasz P. Kozlowski |