Shuttleworthia satelles DSM 14600
Taxonomy: cellular organisms; Bacteria; Terrabacteria group; Firmicutes; Clostridia; Eubacteriales; Lachnospiraceae; Shuttleworthia; Shuttleworthia satelles
Average proteome isoelectric point is 6.55
Get precalculated fractions of proteins
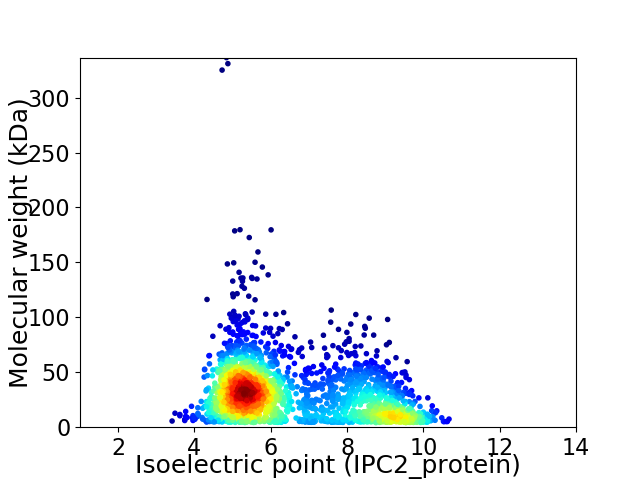
Virtual 2D-PAGE plot for 2247 proteins (isoelectric point calculated using IPC2_protein)
Get csv file with sequences according to given criteria:
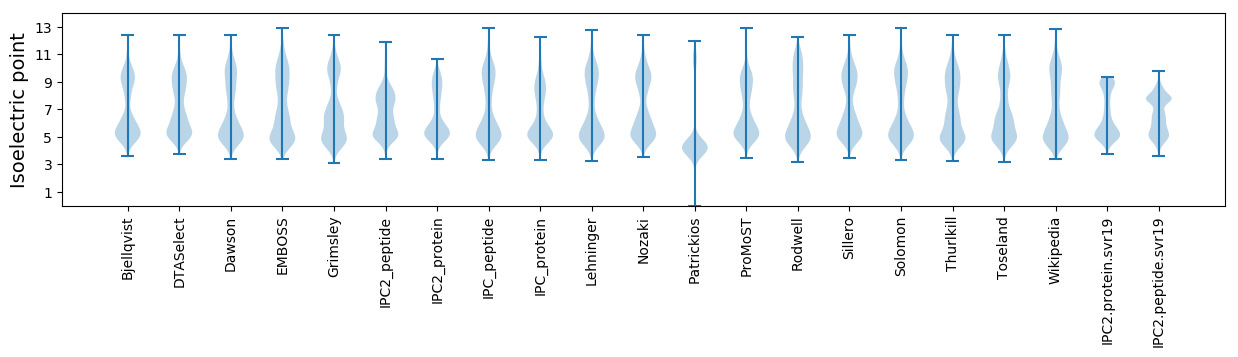
* You can choose from 21 different methods for calculating isoelectric point
Summary statistics related to proteome-wise predictions
Protein with the lowest isoelectric point:
>tr|C4GC82|C4GC82_9FIRM Guanylate kinase-like domain-containing protein OS=Shuttleworthia satelles DSM 14600 OX=626523 GN=GCWU000342_01570 PE=4 SV=1
MM1 pKa = 7.84AEE3 pKa = 3.78NNAPVVNKK11 pKa = 9.36DD12 pKa = 3.34TMIGEE17 pKa = 4.79LLQIDD22 pKa = 4.33TEE24 pKa = 4.21LAPILMSIGMHH35 pKa = 6.49CLGCPSSQMEE45 pKa = 4.76TIAEE49 pKa = 3.94AAMVHH54 pKa = 6.87GYY56 pKa = 10.25DD57 pKa = 4.67ADD59 pKa = 4.16DD60 pKa = 5.11LVDD63 pKa = 5.13EE64 pKa = 4.76INSYY68 pKa = 11.12LSAKK72 pKa = 9.94AASQPAQAA80 pKa = 4.92
MM1 pKa = 7.84AEE3 pKa = 3.78NNAPVVNKK11 pKa = 9.36DD12 pKa = 3.34TMIGEE17 pKa = 4.79LLQIDD22 pKa = 4.33TEE24 pKa = 4.21LAPILMSIGMHH35 pKa = 6.49CLGCPSSQMEE45 pKa = 4.76TIAEE49 pKa = 3.94AAMVHH54 pKa = 6.87GYY56 pKa = 10.25DD57 pKa = 4.67ADD59 pKa = 4.16DD60 pKa = 5.11LVDD63 pKa = 5.13EE64 pKa = 4.76INSYY68 pKa = 11.12LSAKK72 pKa = 9.94AASQPAQAA80 pKa = 4.92
Molecular weight: 8.47 kDa
Isoelectric point according different methods:
Protein with the highest isoelectric point:
>tr|C4G9M2|C4G9M2_9FIRM Cation diffusion facilitator family transporter OS=Shuttleworthia satelles DSM 14600 OX=626523 GN=GCWU000342_00675 PE=4 SV=1
MM1 pKa = 7.67PRR3 pKa = 11.84RR4 pKa = 11.84AINQSSPLRR13 pKa = 11.84NRR15 pKa = 11.84SASKK19 pKa = 10.06IQSLSHH25 pKa = 5.52IRR27 pKa = 11.84AEE29 pKa = 4.67FSAVRR34 pKa = 11.84NFLNDD39 pKa = 2.98LCKK42 pKa = 10.56YY43 pKa = 9.33DD44 pKa = 3.42FCKK47 pKa = 10.79
MM1 pKa = 7.67PRR3 pKa = 11.84RR4 pKa = 11.84AINQSSPLRR13 pKa = 11.84NRR15 pKa = 11.84SASKK19 pKa = 10.06IQSLSHH25 pKa = 5.52IRR27 pKa = 11.84AEE29 pKa = 4.67FSAVRR34 pKa = 11.84NFLNDD39 pKa = 2.98LCKK42 pKa = 10.56YY43 pKa = 9.33DD44 pKa = 3.42FCKK47 pKa = 10.79
Molecular weight: 5.47 kDa
Isoelectric point according different methods:
Peptides (in silico digests for buttom-up proteomics)
Below you can find in silico digests of the whole proteome with Trypsin, Chymotrypsin, Trypsin+LysC, LysN, ArgC proteases suitable for different mass spec machines.| Try ESI |
 |
|---|
| ChTry ESI |
|
|---|
| ArgC ESI |
|
|---|
| LysN ESI |
|
|---|
| TryLysC ESI |
|
|---|
| Try MALDI |
|
|---|
| ChTry MALDI |
|
|---|
| ArgC MALDI |
|
|---|
| LysN MALDI |
|
|---|
| TryLysC MALDI |
|
|---|
| Try LTQ |
|
|---|
| ChTry LTQ |
|
|---|
| ArgC LTQ |
|
|---|
| LysN LTQ |
|
|---|
| TryLysC LTQ |
|
|---|
| Try MSlow |
|
|---|
| ChTry MSlow |
|
|---|
| ArgC MSlow |
|
|---|
| LysN MSlow |
|
|---|
| TryLysC MSlow |
|
|---|
| Try MShigh |
|
|---|
| ChTry MShigh |
|
|---|
| ArgC MShigh |
|
|---|
| LysN MShigh |
|
|---|
| TryLysC MShigh |
|
|---|
General Statistics
Number of major isoforms |
Number of additional isoforms |
Number of all proteins |
Number of amino acids |
Min. Seq. Length |
Max. Seq. Length |
Avg. Seq. Length |
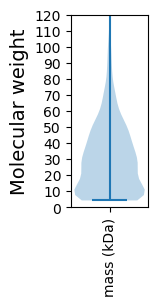
Avg. Mol. Weight |
|---|---|---|---|---|---|---|---|
0 |
649359 |
37 |
2978 |
289.0 |
32.33 |
Amino acid frequency
Ala |
Cys |
Asp |
Glu |
Phe |
Gly |
His |
Ile |
Lys |
Leu |
|---|---|---|---|---|---|---|---|---|---|
8.303 ± 0.067 | 1.305 ± 0.026 |
6.027 ± 0.046 | 7.044 ± 0.062 |
4.004 ± 0.035 | 7.457 ± 0.048 |
1.9 ± 0.023 | 6.894 ± 0.048 |
5.901 ± 0.054 | 9.36 ± 0.073 |
Met |
Asn |
Gln |
Pro |
Arg |
Ser |
Thr |
Val |
Trp |
Tyr |
|---|---|---|---|---|---|---|---|---|---|
3.051 ± 0.03 | 3.698 ± 0.044 |
3.531 ± 0.033 | 3.534 ± 0.03 |
5.966 ± 0.066 | 6.215 ± 0.041 |
4.824 ± 0.064 | 6.394 ± 0.043 |
0.884 ± 0.019 | 3.706 ± 0.032 |
Most of the basic statistics you can see at this page can be downloaded from this CSV file
See this proteome in:

Proteome-pI is available under Creative Commons Attribution-NoDerivs license, for more details see here
| Reference: Kozlowski LP. Proteome-pI 2.0: Proteome Isoelectric Point Database Update. Nucleic Acids Res. 2021, doi: 10.1093/nar/gkab944 | Contact: Lukasz P. Kozlowski |