Pseudomonas rhizosphaerae
Taxonomy: cellular organisms; Bacteria; Proteobacteria; Gammaproteobacteria; Pseudomonadales; Pseudomonadaceae; Pseudomonas
Average proteome isoelectric point is 6.41
Get precalculated fractions of proteins
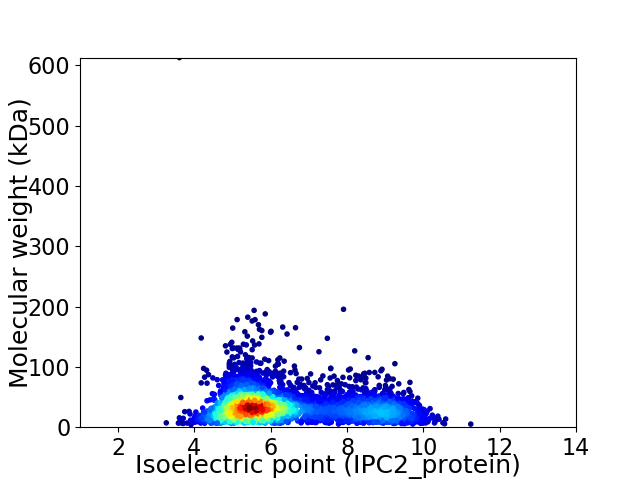
Virtual 2D-PAGE plot for 3893 proteins (isoelectric point calculated using IPC2_protein)
Get csv file with sequences according to given criteria:
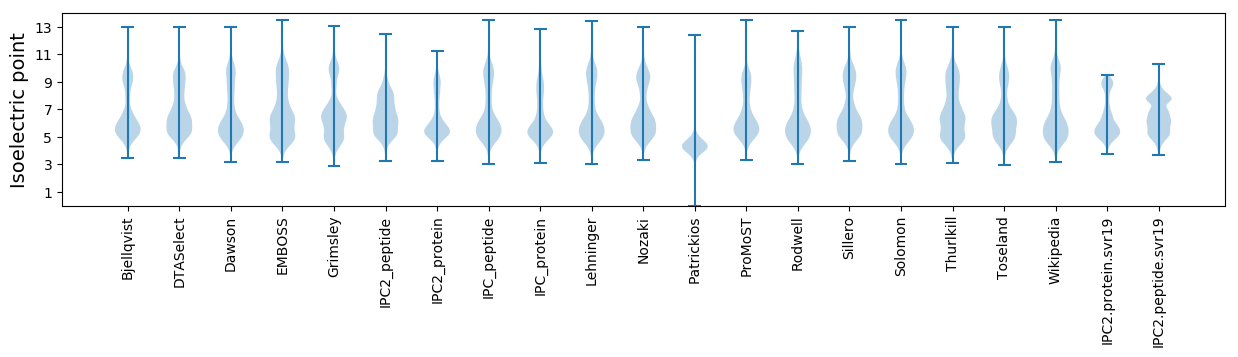
* You can choose from 21 different methods for calculating isoelectric point
Summary statistics related to proteome-wise predictions
Protein with the lowest isoelectric point:
>tr|A0A089ZRC2|A0A089ZRC2_9PSED YccS/YhfK family integral membrane protein OS=Pseudomonas rhizosphaerae OX=216142 GN=LT40_17670 PE=4 SV=1
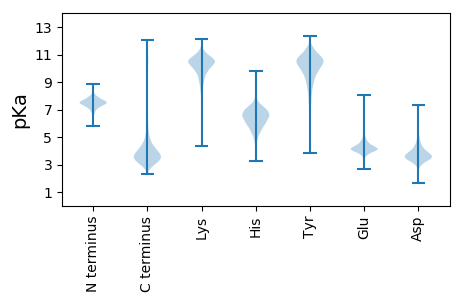
MM1 pKa = 7.56KK2 pKa = 10.04KK3 pKa = 8.44WQCIVCGLIYY13 pKa = 10.62DD14 pKa = 4.59EE15 pKa = 4.86ADD17 pKa = 2.73GWPEE21 pKa = 3.85DD22 pKa = 4.35GIAAGTLWQDD32 pKa = 3.46VPEE35 pKa = 5.1DD36 pKa = 4.13WLCPDD41 pKa = 4.21CGVGKK46 pKa = 9.63MDD48 pKa = 4.86FEE50 pKa = 4.76MIEE53 pKa = 3.9IGG55 pKa = 4.22
MM1 pKa = 7.56KK2 pKa = 10.04KK3 pKa = 8.44WQCIVCGLIYY13 pKa = 10.62DD14 pKa = 4.59EE15 pKa = 4.86ADD17 pKa = 2.73GWPEE21 pKa = 3.85DD22 pKa = 4.35GIAAGTLWQDD32 pKa = 3.46VPEE35 pKa = 5.1DD36 pKa = 4.13WLCPDD41 pKa = 4.21CGVGKK46 pKa = 9.63MDD48 pKa = 4.86FEE50 pKa = 4.76MIEE53 pKa = 3.9IGG55 pKa = 4.22
Molecular weight: 6.18 kDa
Isoelectric point according different methods:
Protein with the highest isoelectric point:
>tr|A0A089YR61|A0A089YR61_9PSED UvrABC system protein B OS=Pseudomonas rhizosphaerae OX=216142 GN=uvrB PE=3 SV=1
MM1 pKa = 7.45KK2 pKa = 9.56RR3 pKa = 11.84TFQPSTIKK11 pKa = 10.52RR12 pKa = 11.84ARR14 pKa = 11.84THH16 pKa = 5.94GFRR19 pKa = 11.84ARR21 pKa = 11.84MATKK25 pKa = 10.28NGRR28 pKa = 11.84TVLSRR33 pKa = 11.84RR34 pKa = 11.84RR35 pKa = 11.84AKK37 pKa = 9.94GRR39 pKa = 11.84KK40 pKa = 8.66RR41 pKa = 11.84LAVV44 pKa = 3.41
MM1 pKa = 7.45KK2 pKa = 9.56RR3 pKa = 11.84TFQPSTIKK11 pKa = 10.52RR12 pKa = 11.84ARR14 pKa = 11.84THH16 pKa = 5.94GFRR19 pKa = 11.84ARR21 pKa = 11.84MATKK25 pKa = 10.28NGRR28 pKa = 11.84TVLSRR33 pKa = 11.84RR34 pKa = 11.84RR35 pKa = 11.84AKK37 pKa = 9.94GRR39 pKa = 11.84KK40 pKa = 8.66RR41 pKa = 11.84LAVV44 pKa = 3.41
Molecular weight: 5.15 kDa
Isoelectric point according different methods:
Peptides (in silico digests for buttom-up proteomics)
Below you can find in silico digests of the whole proteome with Trypsin, Chymotrypsin, Trypsin+LysC, LysN, ArgC proteases suitable for different mass spec machines.| Try ESI |
 |
|---|
| ChTry ESI |
|
|---|
| ArgC ESI |
|
|---|
| LysN ESI |
|
|---|
| TryLysC ESI |
|
|---|
| Try MALDI |
|
|---|
| ChTry MALDI |
|
|---|
| ArgC MALDI |
|
|---|
| LysN MALDI |
|
|---|
| TryLysC MALDI |
|
|---|
| Try LTQ |
|
|---|
| ChTry LTQ |
|
|---|
| ArgC LTQ |
|
|---|
| LysN LTQ |
|
|---|
| TryLysC LTQ |
|
|---|
| Try MSlow |
|
|---|
| ChTry MSlow |
|
|---|
| ArgC MSlow |
|
|---|
| LysN MSlow |
|
|---|
| TryLysC MSlow |
|
|---|
| Try MShigh |
|
|---|
| ChTry MShigh |
|
|---|
| ArgC MShigh |
|
|---|
| LysN MShigh |
|
|---|
| TryLysC MShigh |
|
|---|
General Statistics
Number of major isoforms |
Number of additional isoforms |
Number of all proteins |
Number of amino acids |
Min. Seq. Length |
Max. Seq. Length |
Avg. Seq. Length |
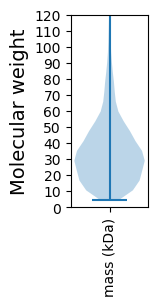
Avg. Mol. Weight |
|---|---|---|---|---|---|---|---|
0 |
1299839 |
38 |
6317 |
333.9 |
36.51 |
Amino acid frequency
Ala |
Cys |
Asp |
Glu |
Phe |
Gly |
His |
Ile |
Lys |
Leu |
|---|---|---|---|---|---|---|---|---|---|
11.332 ± 0.051 | 0.96 ± 0.014 |
5.429 ± 0.029 | 5.49 ± 0.038 |
3.58 ± 0.027 | 8.023 ± 0.04 |
2.294 ± 0.024 | 4.781 ± 0.03 |
3.34 ± 0.035 | 11.597 ± 0.057 |
Met |
Asn |
Gln |
Pro |
Arg |
Ser |
Thr |
Val |
Trp |
Tyr |
|---|---|---|---|---|---|---|---|---|---|
2.368 ± 0.02 | 2.931 ± 0.029 |
4.84 ± 0.025 | 4.648 ± 0.033 |
6.4 ± 0.044 | 5.697 ± 0.028 |
5.015 ± 0.047 | 7.412 ± 0.039 |
1.391 ± 0.017 | 2.471 ± 0.022 |
Most of the basic statistics you can see at this page can be downloaded from this CSV file
See this proteome in:

Proteome-pI is available under Creative Commons Attribution-NoDerivs license, for more details see here
| Reference: Kozlowski LP. Proteome-pI 2.0: Proteome Isoelectric Point Database Update. Nucleic Acids Res. 2021, doi: 10.1093/nar/gkab944 | Contact: Lukasz P. Kozlowski |