Methyloceanibacter methanicus
Taxonomy: cellular organisms; Bacteria; Proteobacteria; Alphaproteobacteria; Hyphomicrobiales; Hyphomicrobiaceae; Methyloceanibacter
Average proteome isoelectric point is 6.31
Get precalculated fractions of proteins
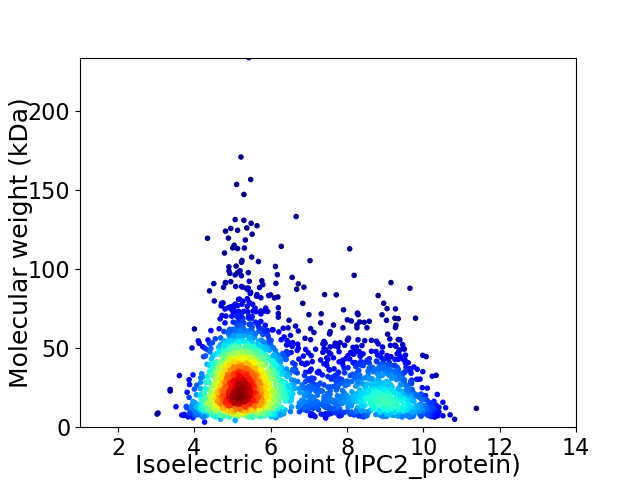
Virtual 2D-PAGE plot for 2710 proteins (isoelectric point calculated using IPC2_protein)
Get csv file with sequences according to given criteria:
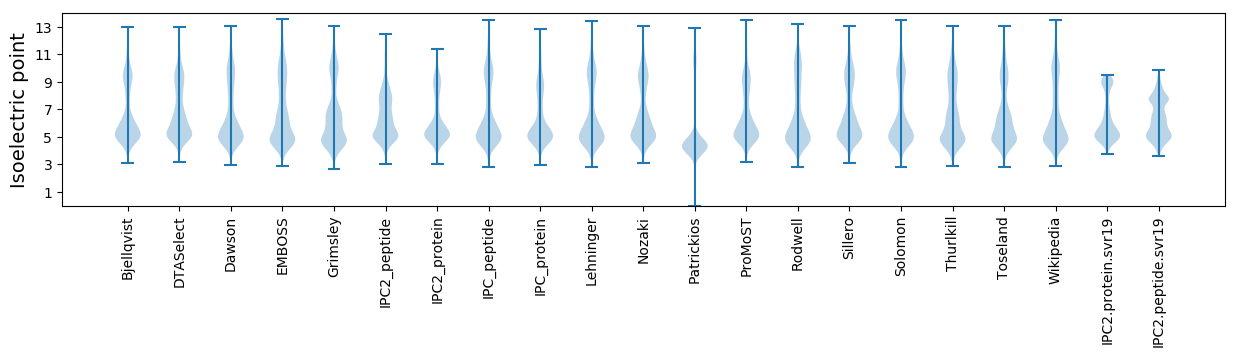
* You can choose from 21 different methods for calculating isoelectric point
Summary statistics related to proteome-wise predictions
Protein with the lowest isoelectric point:
>tr|A0A1E3W3J0|A0A1E3W3J0_9RHIZ Uncharacterized protein OS=Methyloceanibacter methanicus OX=1774968 GN=AUC68_01010 PE=4 SV=1
MM1 pKa = 7.54IASCPDD7 pKa = 2.8GRR9 pKa = 11.84SAGTCLALLASAMQFAALALPGGAACAKK37 pKa = 10.11DD38 pKa = 4.36DD39 pKa = 4.17NAALAQQLANPIADD53 pKa = 3.64LTVVPFQYY61 pKa = 11.15DD62 pKa = 3.48LLLNGGPDD70 pKa = 3.65GDD72 pKa = 3.93ATGSVLTIQPIIPIHH87 pKa = 6.74LNKK90 pKa = 10.27DD91 pKa = 2.79WNLITRR97 pKa = 11.84TILPVAYY104 pKa = 10.04ASGIPTGDD112 pKa = 3.09FGGLGDD118 pKa = 3.97TQFSAFLSPQKK129 pKa = 10.63SGADD133 pKa = 3.43GLVWGIGSIVNLPTATNSDD152 pKa = 3.77LGTSEE157 pKa = 3.87WGAGPTAVALVQKK170 pKa = 10.21GPWTVGALANHH181 pKa = 7.28LWTFDD186 pKa = 3.82DD187 pKa = 4.82APAGAATRR195 pKa = 11.84SLTTTGAGYY204 pKa = 10.83VDD206 pKa = 3.66QTFTQPWVTYY216 pKa = 9.29GWGSGQSVTLTSQTSYY232 pKa = 10.63NWNSDD237 pKa = 2.91EE238 pKa = 4.0WTVPLNLTYY247 pKa = 10.77QSVGKK252 pKa = 10.6LGDD255 pKa = 3.25QSVQFQVGGAYY266 pKa = 10.28APIVPDD272 pKa = 5.6DD273 pKa = 3.76YY274 pKa = 11.6PNWGLQASLIFLFPNN289 pKa = 3.73
MM1 pKa = 7.54IASCPDD7 pKa = 2.8GRR9 pKa = 11.84SAGTCLALLASAMQFAALALPGGAACAKK37 pKa = 10.11DD38 pKa = 4.36DD39 pKa = 4.17NAALAQQLANPIADD53 pKa = 3.64LTVVPFQYY61 pKa = 11.15DD62 pKa = 3.48LLLNGGPDD70 pKa = 3.65GDD72 pKa = 3.93ATGSVLTIQPIIPIHH87 pKa = 6.74LNKK90 pKa = 10.27DD91 pKa = 2.79WNLITRR97 pKa = 11.84TILPVAYY104 pKa = 10.04ASGIPTGDD112 pKa = 3.09FGGLGDD118 pKa = 3.97TQFSAFLSPQKK129 pKa = 10.63SGADD133 pKa = 3.43GLVWGIGSIVNLPTATNSDD152 pKa = 3.77LGTSEE157 pKa = 3.87WGAGPTAVALVQKK170 pKa = 10.21GPWTVGALANHH181 pKa = 7.28LWTFDD186 pKa = 3.82DD187 pKa = 4.82APAGAATRR195 pKa = 11.84SLTTTGAGYY204 pKa = 10.83VDD206 pKa = 3.66QTFTQPWVTYY216 pKa = 9.29GWGSGQSVTLTSQTSYY232 pKa = 10.63NWNSDD237 pKa = 2.91EE238 pKa = 4.0WTVPLNLTYY247 pKa = 10.77QSVGKK252 pKa = 10.6LGDD255 pKa = 3.25QSVQFQVGGAYY266 pKa = 10.28APIVPDD272 pKa = 5.6DD273 pKa = 3.76YY274 pKa = 11.6PNWGLQASLIFLFPNN289 pKa = 3.73
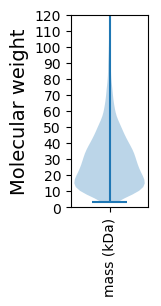
Molecular weight: 30.07 kDa
Isoelectric point according different methods:
Protein with the highest isoelectric point:
>tr|A0A1E3VZB5|A0A1E3VZB5_9RHIZ MoCF_biosynth domain-containing protein OS=Methyloceanibacter methanicus OX=1774968 GN=AUC68_06610 PE=4 SV=1
MM1 pKa = 7.46AVAKK5 pKa = 10.45KK6 pKa = 8.96KK7 pKa = 8.77TATKK11 pKa = 10.2KK12 pKa = 9.94KK13 pKa = 10.3APAKK17 pKa = 9.98RR18 pKa = 11.84KK19 pKa = 7.46TVAKK23 pKa = 9.82KK24 pKa = 9.1KK25 pKa = 8.58TVAKK29 pKa = 10.06KK30 pKa = 9.85RR31 pKa = 11.84APAKK35 pKa = 10.01RR36 pKa = 11.84KK37 pKa = 6.74TVRR40 pKa = 11.84KK41 pKa = 5.27TTAAKK46 pKa = 10.06KK47 pKa = 9.96RR48 pKa = 11.84VVKK51 pKa = 10.52KK52 pKa = 10.21RR53 pKa = 11.84APAKK57 pKa = 10.39KK58 pKa = 9.7RR59 pKa = 11.84VAKK62 pKa = 10.39KK63 pKa = 9.9KK64 pKa = 10.69APAKK68 pKa = 10.02KK69 pKa = 8.59KK70 pKa = 7.54TVRR73 pKa = 11.84KK74 pKa = 7.16TAAAKK79 pKa = 10.12KK80 pKa = 8.75RR81 pKa = 11.84TVKK84 pKa = 10.5KK85 pKa = 10.24SAPAKK90 pKa = 10.27KK91 pKa = 9.74RR92 pKa = 11.84VAKK95 pKa = 10.28KK96 pKa = 9.07KK97 pKa = 8.44TVAKK101 pKa = 10.29KK102 pKa = 9.68RR103 pKa = 11.84AKK105 pKa = 9.07KK106 pKa = 7.9TAA108 pKa = 3.25
MM1 pKa = 7.46AVAKK5 pKa = 10.45KK6 pKa = 8.96KK7 pKa = 8.77TATKK11 pKa = 10.2KK12 pKa = 9.94KK13 pKa = 10.3APAKK17 pKa = 9.98RR18 pKa = 11.84KK19 pKa = 7.46TVAKK23 pKa = 9.82KK24 pKa = 9.1KK25 pKa = 8.58TVAKK29 pKa = 10.06KK30 pKa = 9.85RR31 pKa = 11.84APAKK35 pKa = 10.01RR36 pKa = 11.84KK37 pKa = 6.74TVRR40 pKa = 11.84KK41 pKa = 5.27TTAAKK46 pKa = 10.06KK47 pKa = 9.96RR48 pKa = 11.84VVKK51 pKa = 10.52KK52 pKa = 10.21RR53 pKa = 11.84APAKK57 pKa = 10.39KK58 pKa = 9.7RR59 pKa = 11.84VAKK62 pKa = 10.39KK63 pKa = 9.9KK64 pKa = 10.69APAKK68 pKa = 10.02KK69 pKa = 8.59KK70 pKa = 7.54TVRR73 pKa = 11.84KK74 pKa = 7.16TAAAKK79 pKa = 10.12KK80 pKa = 8.75RR81 pKa = 11.84TVKK84 pKa = 10.5KK85 pKa = 10.24SAPAKK90 pKa = 10.27KK91 pKa = 9.74RR92 pKa = 11.84VAKK95 pKa = 10.28KK96 pKa = 9.07KK97 pKa = 8.44TVAKK101 pKa = 10.29KK102 pKa = 9.68RR103 pKa = 11.84AKK105 pKa = 9.07KK106 pKa = 7.9TAA108 pKa = 3.25
Molecular weight: 11.9 kDa
Isoelectric point according different methods:
Peptides (in silico digests for buttom-up proteomics)
Below you can find in silico digests of the whole proteome with Trypsin, Chymotrypsin, Trypsin+LysC, LysN, ArgC proteases suitable for different mass spec machines.| Try ESI |
 |
|---|
| ChTry ESI |
|
|---|
| ArgC ESI |
|
|---|
| LysN ESI |
|
|---|
| TryLysC ESI |
|
|---|
| Try MALDI |
|
|---|
| ChTry MALDI |
|
|---|
| ArgC MALDI |
|
|---|
| LysN MALDI |
|
|---|
| TryLysC MALDI |
|
|---|
| Try LTQ |
|
|---|
| ChTry LTQ |
|
|---|
| ArgC LTQ |
|
|---|
| LysN LTQ |
|
|---|
| TryLysC LTQ |
|
|---|
| Try MSlow |
|
|---|
| ChTry MSlow |
|
|---|
| ArgC MSlow |
|
|---|
| LysN MSlow |
|
|---|
| TryLysC MSlow |
|
|---|
| Try MShigh |
|
|---|
| ChTry MShigh |
|
|---|
| ArgC MShigh |
|
|---|
| LysN MShigh |
|
|---|
| TryLysC MShigh |
|
|---|
General Statistics
Number of major isoforms |
Number of additional isoforms |
Number of all proteins |
Number of amino acids |
Min. Seq. Length |
Max. Seq. Length |
Avg. Seq. Length |
Avg. Mol. Weight |
|---|---|---|---|---|---|---|---|
0 |
768685 |
29 |
2157 |
283.6 |
30.82 |
Amino acid frequency
Ala |
Cys |
Asp |
Glu |
Phe |
Gly |
His |
Ile |
Lys |
Leu |
|---|---|---|---|---|---|---|---|---|---|
12.242 ± 0.073 | 0.936 ± 0.017 |
5.995 ± 0.035 | 6.095 ± 0.044 |
3.676 ± 0.032 | 8.517 ± 0.048 |
2.02 ± 0.023 | 4.841 ± 0.034 |
3.697 ± 0.037 | 10.004 ± 0.059 |
Met |
Asn |
Gln |
Pro |
Arg |
Ser |
Thr |
Val |
Trp |
Tyr |
|---|---|---|---|---|---|---|---|---|---|
2.335 ± 0.021 | 2.518 ± 0.027 |
5.365 ± 0.035 | 2.999 ± 0.027 |
6.937 ± 0.047 | 5.278 ± 0.035 |
5.406 ± 0.034 | 7.485 ± 0.043 |
1.307 ± 0.018 | 2.346 ± 0.026 |
Most of the basic statistics you can see at this page can be downloaded from this CSV file
See this proteome in:

Proteome-pI is available under Creative Commons Attribution-NoDerivs license, for more details see here
| Reference: Kozlowski LP. Proteome-pI 2.0: Proteome Isoelectric Point Database Update. Nucleic Acids Res. 2021, doi: 10.1093/nar/gkab944 | Contact: Lukasz P. Kozlowski |