Microbacterium phage Nucci
Taxonomy: Viruses; Duplodnaviria; Heunggongvirae; Uroviricota; Caudoviricetes; Caudovirales; Siphoviridae; Elerivirus; unclassified Elerivirus
Average proteome isoelectric point is 6.25
Get precalculated fractions of proteins
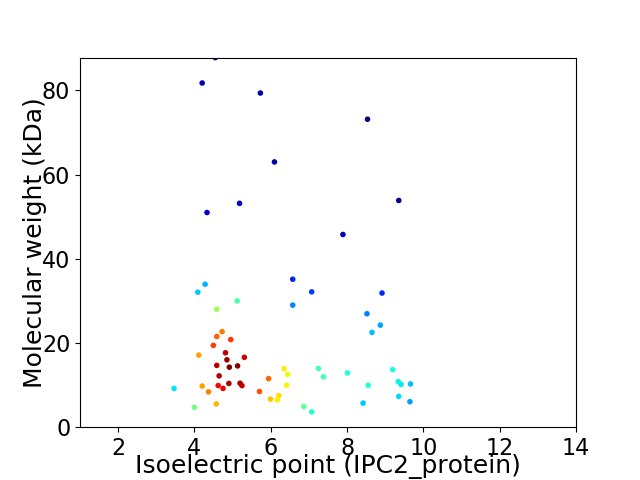
Virtual 2D-PAGE plot for 63 proteins (isoelectric point calculated using IPC2_protein)
Get csv file with sequences according to given criteria:
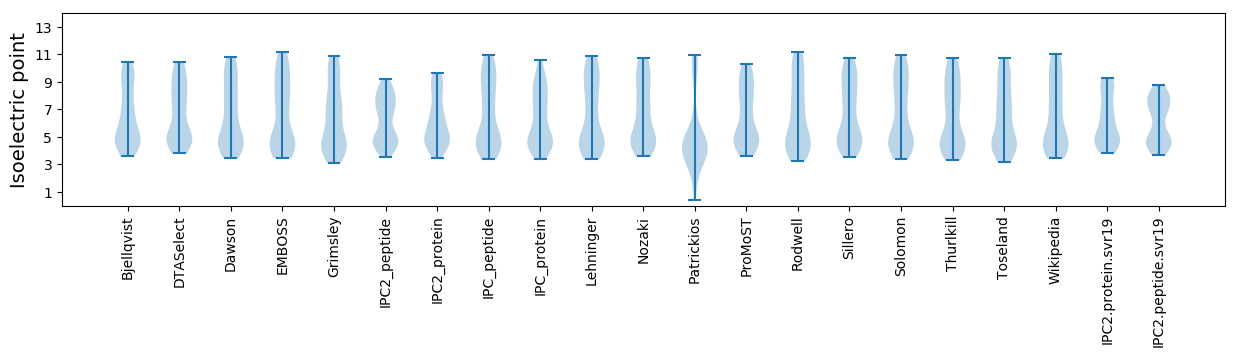
* You can choose from 21 different methods for calculating isoelectric point
Summary statistics related to proteome-wise predictions
Protein with the lowest isoelectric point:
>tr|A0A514U0J1|A0A514U0J1_9CAUD Thymidylate synthase OS=Microbacterium phage Nucci OX=2593340 GN=48 PE=3 SV=1
MM1 pKa = 7.89GYY3 pKa = 10.25LCDD6 pKa = 3.85HH7 pKa = 7.34CDD9 pKa = 3.01VSLQVDD15 pKa = 3.63PNGYY19 pKa = 9.66FVDD22 pKa = 4.46DD23 pKa = 4.93SGSSDD28 pKa = 3.62CPKK31 pKa = 10.93DD32 pKa = 3.67EE33 pKa = 5.78GGHH36 pKa = 4.3TWEE39 pKa = 4.99GRR41 pKa = 11.84AGLL44 pKa = 3.97
MM1 pKa = 7.89GYY3 pKa = 10.25LCDD6 pKa = 3.85HH7 pKa = 7.34CDD9 pKa = 3.01VSLQVDD15 pKa = 3.63PNGYY19 pKa = 9.66FVDD22 pKa = 4.46DD23 pKa = 4.93SGSSDD28 pKa = 3.62CPKK31 pKa = 10.93DD32 pKa = 3.67EE33 pKa = 5.78GGHH36 pKa = 4.3TWEE39 pKa = 4.99GRR41 pKa = 11.84AGLL44 pKa = 3.97
Molecular weight: 4.73 kDa
Isoelectric point according different methods:
Protein with the highest isoelectric point:
>tr|A0A514U0G5|A0A514U0G5_9CAUD Thymidylate kinase OS=Microbacterium phage Nucci OX=2593340 GN=44 PE=4 SV=1
MM1 pKa = 8.0DD2 pKa = 6.06PDD4 pKa = 3.73KK5 pKa = 11.44VLATVSPALRR15 pKa = 11.84ASLEE19 pKa = 3.99RR20 pKa = 11.84QLIQINRR27 pKa = 11.84NYY29 pKa = 9.22MAALARR35 pKa = 11.84LYY37 pKa = 10.4QVDD40 pKa = 3.41IRR42 pKa = 11.84TVLIWHH48 pKa = 5.95ATGRR52 pKa = 11.84VV53 pKa = 3.21
MM1 pKa = 8.0DD2 pKa = 6.06PDD4 pKa = 3.73KK5 pKa = 11.44VLATVSPALRR15 pKa = 11.84ASLEE19 pKa = 3.99RR20 pKa = 11.84QLIQINRR27 pKa = 11.84NYY29 pKa = 9.22MAALARR35 pKa = 11.84LYY37 pKa = 10.4QVDD40 pKa = 3.41IRR42 pKa = 11.84TVLIWHH48 pKa = 5.95ATGRR52 pKa = 11.84VV53 pKa = 3.21
Molecular weight: 6.05 kDa
Isoelectric point according different methods:
Peptides (in silico digests for buttom-up proteomics)
Below you can find in silico digests of the whole proteome with Trypsin, Chymotrypsin, Trypsin+LysC, LysN, ArgC proteases suitable for different mass spec machines.| Try ESI |
 |
|---|
| ChTry ESI |
|
|---|
| ArgC ESI |
|
|---|
| LysN ESI |
|
|---|
| TryLysC ESI |
|
|---|
| Try MALDI |
|
|---|
| ChTry MALDI |
|
|---|
| ArgC MALDI |
|
|---|
| LysN MALDI |
|
|---|
| TryLysC MALDI |
|
|---|
| Try LTQ |
|
|---|
| ChTry LTQ |
|
|---|
| ArgC LTQ |
|
|---|
| LysN LTQ |
|
|---|
| TryLysC LTQ |
|
|---|
| Try MSlow |
|
|---|
| ChTry MSlow |
|
|---|
| ArgC MSlow |
|
|---|
| LysN MSlow |
|
|---|
| TryLysC MSlow |
|
|---|
| Try MShigh |
|
|---|
| ChTry MShigh |
|
|---|
| ArgC MShigh |
|
|---|
| LysN MShigh |
|
|---|
| TryLysC MShigh |
|
|---|
General Statistics
Number of major isoforms |
Number of additional isoforms |
Number of all proteins |
Number of amino acids |
Min. Seq. Length |
Max. Seq. Length |
Avg. Seq. Length |
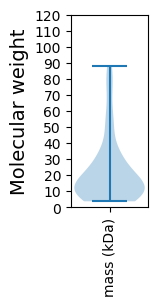
Avg. Mol. Weight |
|---|---|---|---|---|---|---|---|
0 |
12789 |
35 |
808 |
203.0 |
22.36 |
Amino acid frequency
Ala |
Cys |
Asp |
Glu |
Phe |
Gly |
His |
Ile |
Lys |
Leu |
|---|---|---|---|---|---|---|---|---|---|
10.048 ± 0.431 | 0.672 ± 0.096 |
6.662 ± 0.306 | 5.958 ± 0.42 |
3.049 ± 0.181 | 7.976 ± 0.357 |
1.798 ± 0.169 | 4.926 ± 0.384 |
4.676 ± 0.355 | 8.351 ± 0.292 |
Met |
Asn |
Gln |
Pro |
Arg |
Ser |
Thr |
Val |
Trp |
Tyr |
|---|---|---|---|---|---|---|---|---|---|
2.604 ± 0.141 | 3.37 ± 0.218 |
4.871 ± 0.218 | 3.972 ± 0.2 |
5.88 ± 0.365 | 5.692 ± 0.288 |
6.85 ± 0.337 | 7.694 ± 0.276 |
2.096 ± 0.248 | 2.854 ± 0.231 |
Most of the basic statistics you can see at this page can be downloaded from this CSV file
See this proteome in:

Proteome-pI is available under Creative Commons Attribution-NoDerivs license, for more details see here
| Reference: Kozlowski LP. Proteome-pI 2.0: Proteome Isoelectric Point Database Update. Nucleic Acids Res. 2021, doi: 10.1093/nar/gkab944 | Contact: Lukasz P. Kozlowski |