Rhizobium phage RL2RES
Taxonomy: Viruses; Duplodnaviria; Heunggongvirae; Uroviricota; Caudoviricetes; Caudovirales; Ackermannviridae; unclassified Ackermannviridae
Average proteome isoelectric point is 6.12
Get precalculated fractions of proteins
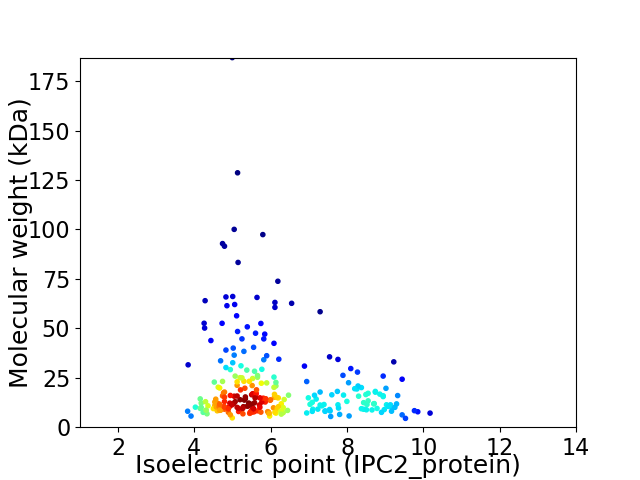
Virtual 2D-PAGE plot for 261 proteins (isoelectric point calculated using IPC2_protein)
Get csv file with sequences according to given criteria:
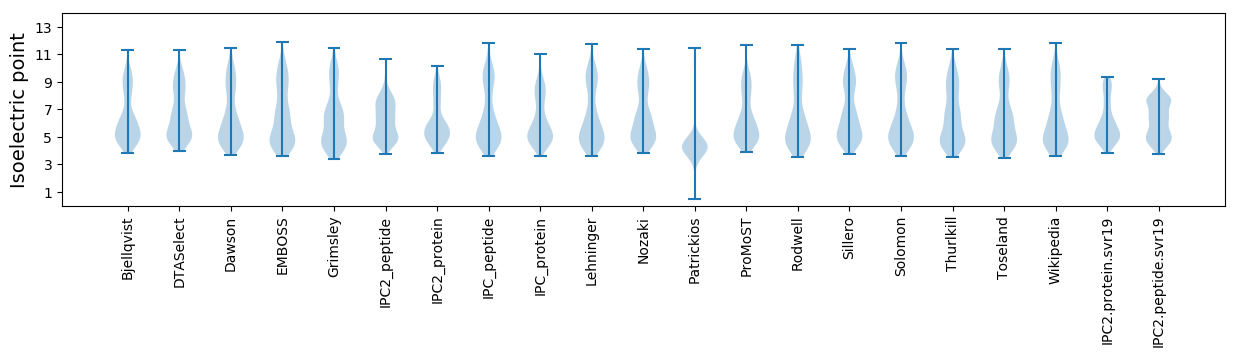
* You can choose from 21 different methods for calculating isoelectric point
Summary statistics related to proteome-wise predictions
Protein with the lowest isoelectric point:
>tr|A0A6B9J1M5|A0A6B9J1M5_9CAUD Putative tail sheath stabilizer and completion protein OS=Rhizobium phage RL2RES OX=103371 GN=RL2RES_236 PE=4 SV=1
MM1 pKa = 7.38TWQQGMVNFLTIIFGIIAGALFNNLGEE28 pKa = 4.7APDD31 pKa = 3.47LTMGQRR37 pKa = 11.84YY38 pKa = 8.55FYY40 pKa = 10.2FAGFIVSMIIVLYY53 pKa = 10.5SLYY56 pKa = 10.37KK57 pKa = 10.58ASNEE61 pKa = 4.01MFGDD65 pKa = 4.69DD66 pKa = 5.89DD67 pKa = 5.55DD68 pKa = 4.54LTPAA72 pKa = 4.5
MM1 pKa = 7.38TWQQGMVNFLTIIFGIIAGALFNNLGEE28 pKa = 4.7APDD31 pKa = 3.47LTMGQRR37 pKa = 11.84YY38 pKa = 8.55FYY40 pKa = 10.2FAGFIVSMIIVLYY53 pKa = 10.5SLYY56 pKa = 10.37KK57 pKa = 10.58ASNEE61 pKa = 4.01MFGDD65 pKa = 4.69DD66 pKa = 5.89DD67 pKa = 5.55DD68 pKa = 4.54LTPAA72 pKa = 4.5
Molecular weight: 8.07 kDa
Isoelectric point according different methods:
Protein with the highest isoelectric point:
>tr|A0A6B9J1N3|A0A6B9J1N3_9CAUD Uncharacterized protein OS=Rhizobium phage RL2RES OX=103371 GN=RL2RES_207 PE=4 SV=1
MM1 pKa = 6.54STYY4 pKa = 10.53RR5 pKa = 11.84FCGCTKK11 pKa = 9.46CKK13 pKa = 9.99KK14 pKa = 8.6MRR16 pKa = 11.84RR17 pKa = 11.84KK18 pKa = 10.32GLVLGTRR25 pKa = 11.84NMGFWLTRR33 pKa = 11.84FGRR36 pKa = 11.84LEE38 pKa = 4.12YY39 pKa = 10.93YY40 pKa = 10.43LGPVSDD46 pKa = 4.34YY47 pKa = 10.76VRR49 pKa = 11.84HH50 pKa = 5.81PRR52 pKa = 11.84FFGRR56 pKa = 11.84RR57 pKa = 11.84PDD59 pKa = 3.35PKK61 pKa = 10.38FNKK64 pKa = 9.97KK65 pKa = 9.71EE66 pKa = 3.84IQEE69 pKa = 4.09
MM1 pKa = 6.54STYY4 pKa = 10.53RR5 pKa = 11.84FCGCTKK11 pKa = 9.46CKK13 pKa = 9.99KK14 pKa = 8.6MRR16 pKa = 11.84RR17 pKa = 11.84KK18 pKa = 10.32GLVLGTRR25 pKa = 11.84NMGFWLTRR33 pKa = 11.84FGRR36 pKa = 11.84LEE38 pKa = 4.12YY39 pKa = 10.93YY40 pKa = 10.43LGPVSDD46 pKa = 4.34YY47 pKa = 10.76VRR49 pKa = 11.84HH50 pKa = 5.81PRR52 pKa = 11.84FFGRR56 pKa = 11.84RR57 pKa = 11.84PDD59 pKa = 3.35PKK61 pKa = 10.38FNKK64 pKa = 9.97KK65 pKa = 9.71EE66 pKa = 3.84IQEE69 pKa = 4.09
Molecular weight: 8.36 kDa
Isoelectric point according different methods:
Peptides (in silico digests for buttom-up proteomics)
Below you can find in silico digests of the whole proteome with Trypsin, Chymotrypsin, Trypsin+LysC, LysN, ArgC proteases suitable for different mass spec machines.| Try ESI |
 |
|---|
| ChTry ESI |
|
|---|
| ArgC ESI |
|
|---|
| LysN ESI |
|
|---|
| TryLysC ESI |
|
|---|
| Try MALDI |
|
|---|
| ChTry MALDI |
|
|---|
| ArgC MALDI |
|
|---|
| LysN MALDI |
|
|---|
| TryLysC MALDI |
|
|---|
| Try LTQ |
|
|---|
| ChTry LTQ |
|
|---|
| ArgC LTQ |
|
|---|
| LysN LTQ |
|
|---|
| TryLysC LTQ |
|
|---|
| Try MSlow |
|
|---|
| ChTry MSlow |
|
|---|
| ArgC MSlow |
|
|---|
| LysN MSlow |
|
|---|
| TryLysC MSlow |
|
|---|
| Try MShigh |
|
|---|
| ChTry MShigh |
|
|---|
| ArgC MShigh |
|
|---|
| LysN MShigh |
|
|---|
| TryLysC MShigh |
|
|---|
General Statistics
Number of major isoforms |
Number of additional isoforms |
Number of all proteins |
Number of amino acids |
Min. Seq. Length |
Max. Seq. Length |
Avg. Seq. Length |
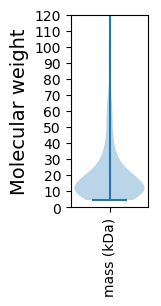
Avg. Mol. Weight |
|---|---|---|---|---|---|---|---|
0 |
49062 |
37 |
1708 |
188.0 |
21.33 |
Amino acid frequency
Ala |
Cys |
Asp |
Glu |
Phe |
Gly |
His |
Ile |
Lys |
Leu |
|---|---|---|---|---|---|---|---|---|---|
6.439 ± 0.163 | 0.85 ± 0.058 |
6.948 ± 0.13 | 6.973 ± 0.236 |
5.073 ± 0.136 | 6.196 ± 0.222 |
1.849 ± 0.095 | 6.669 ± 0.123 |
6.901 ± 0.206 | 7.678 ± 0.146 |
Met |
Asn |
Gln |
Pro |
Arg |
Ser |
Thr |
Val |
Trp |
Tyr |
|---|---|---|---|---|---|---|---|---|---|
2.507 ± 0.11 | 5.246 ± 0.109 |
3.441 ± 0.094 | 3.147 ± 0.097 |
5.132 ± 0.139 | 6.612 ± 0.183 |
6.155 ± 0.235 | 7.028 ± 0.173 |
1.276 ± 0.065 | 3.879 ± 0.114 |
Most of the basic statistics you can see at this page can be downloaded from this CSV file
See this proteome in:

Proteome-pI is available under Creative Commons Attribution-NoDerivs license, for more details see here
| Reference: Kozlowski LP. Proteome-pI 2.0: Proteome Isoelectric Point Database Update. Nucleic Acids Res. 2021, doi: 10.1093/nar/gkab944 | Contact: Lukasz P. Kozlowski |