Corynebacterium atypicum
Taxonomy: cellular organisms; Bacteria; Terrabacteria group; Actinobacteria; Actinomycetia; Corynebacteriales;
Average proteome isoelectric point is 6.05
Get precalculated fractions of proteins
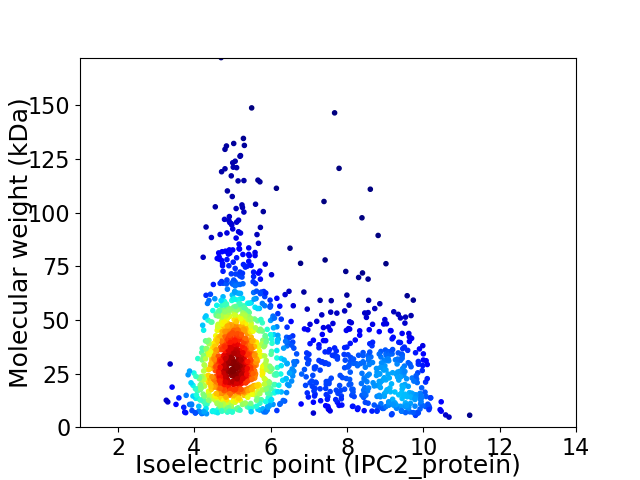
Virtual 2D-PAGE plot for 1533 proteins (isoelectric point calculated using IPC2_protein)
Get csv file with sequences according to given criteria:
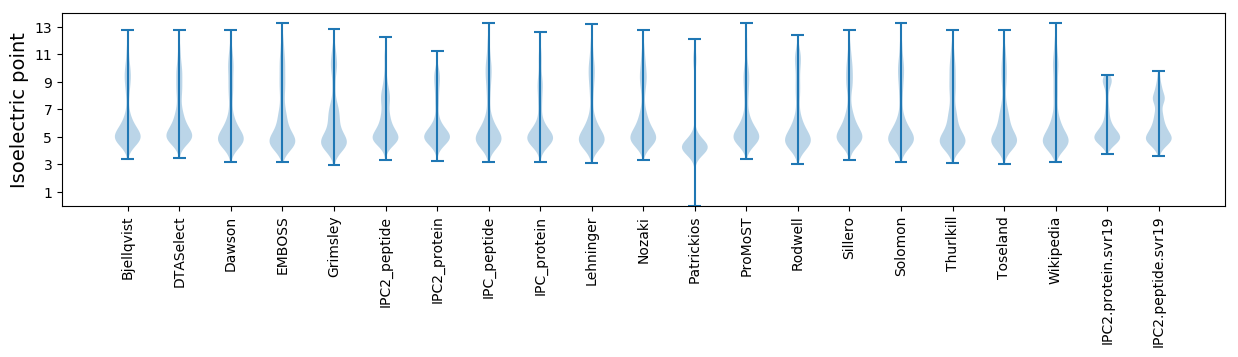
* You can choose from 21 different methods for calculating isoelectric point
Summary statistics related to proteome-wise predictions
Protein with the lowest isoelectric point:
>tr|A0A075TTJ3|A0A075TTJ3_9CORY Aspartate-semialdehyde dehydrogenase OS=Corynebacterium atypicum OX=191610 GN=asd PE=3 SV=1
MM1 pKa = 7.78KK2 pKa = 8.83MTDD5 pKa = 4.34DD6 pKa = 4.92DD7 pKa = 4.78GEE9 pKa = 4.6LPVFLDD15 pKa = 3.54DD16 pKa = 4.41QSYY19 pKa = 7.81RR20 pKa = 11.84TCSEE24 pKa = 4.16CTSDD28 pKa = 4.76CVPDD32 pKa = 3.88PFIAGEE38 pKa = 4.18GQGIRR43 pKa = 11.84IAFICPSCGVQSVIDD58 pKa = 4.01PFEE61 pKa = 4.15DD62 pKa = 3.4TRR64 pKa = 4.57
MM1 pKa = 7.78KK2 pKa = 8.83MTDD5 pKa = 4.34DD6 pKa = 4.92DD7 pKa = 4.78GEE9 pKa = 4.6LPVFLDD15 pKa = 3.54DD16 pKa = 4.41QSYY19 pKa = 7.81RR20 pKa = 11.84TCSEE24 pKa = 4.16CTSDD28 pKa = 4.76CVPDD32 pKa = 3.88PFIAGEE38 pKa = 4.18GQGIRR43 pKa = 11.84IAFICPSCGVQSVIDD58 pKa = 4.01PFEE61 pKa = 4.15DD62 pKa = 3.4TRR64 pKa = 4.57
Molecular weight: 7.02 kDa
Isoelectric point according different methods:
Protein with the highest isoelectric point:
>tr|A0A075TTS0|A0A075TTS0_9CORY Delta-aminolevulinic acid dehydratase OS=Corynebacterium atypicum OX=191610 GN=CATYP_01650 PE=3 SV=1
MM1 pKa = 7.47SKK3 pKa = 10.58GKK5 pKa = 8.48RR6 pKa = 11.84TYY8 pKa = 10.09QPNNRR13 pKa = 11.84RR14 pKa = 11.84RR15 pKa = 11.84ARR17 pKa = 11.84KK18 pKa = 8.01HH19 pKa = 4.51GFRR22 pKa = 11.84IRR24 pKa = 11.84MRR26 pKa = 11.84TRR28 pKa = 11.84AGRR31 pKa = 11.84AIIAARR37 pKa = 11.84RR38 pKa = 11.84RR39 pKa = 11.84KK40 pKa = 9.72GRR42 pKa = 11.84AKK44 pKa = 9.63LTAA47 pKa = 4.21
MM1 pKa = 7.47SKK3 pKa = 10.58GKK5 pKa = 8.48RR6 pKa = 11.84TYY8 pKa = 10.09QPNNRR13 pKa = 11.84RR14 pKa = 11.84RR15 pKa = 11.84ARR17 pKa = 11.84KK18 pKa = 8.01HH19 pKa = 4.51GFRR22 pKa = 11.84IRR24 pKa = 11.84MRR26 pKa = 11.84TRR28 pKa = 11.84AGRR31 pKa = 11.84AIIAARR37 pKa = 11.84RR38 pKa = 11.84RR39 pKa = 11.84KK40 pKa = 9.72GRR42 pKa = 11.84AKK44 pKa = 9.63LTAA47 pKa = 4.21
Molecular weight: 5.58 kDa
Isoelectric point according different methods:
Peptides (in silico digests for buttom-up proteomics)
Below you can find in silico digests of the whole proteome with Trypsin, Chymotrypsin, Trypsin+LysC, LysN, ArgC proteases suitable for different mass spec machines.| Try ESI |
 |
|---|
| ChTry ESI |
|
|---|
| ArgC ESI |
|
|---|
| LysN ESI |
|
|---|
| TryLysC ESI |
|
|---|
| Try MALDI |
|
|---|
| ChTry MALDI |
|
|---|
| ArgC MALDI |
|
|---|
| LysN MALDI |
|
|---|
| TryLysC MALDI |
|
|---|
| Try LTQ |
|
|---|
| ChTry LTQ |
|
|---|
| ArgC LTQ |
|
|---|
| LysN LTQ |
|
|---|
| TryLysC LTQ |
|
|---|
| Try MSlow |
|
|---|
| ChTry MSlow |
|
|---|
| ArgC MSlow |
|
|---|
| LysN MSlow |
|
|---|
| TryLysC MSlow |
|
|---|
| Try MShigh |
|
|---|
| ChTry MShigh |
|
|---|
| ArgC MShigh |
|
|---|
| LysN MShigh |
|
|---|
| TryLysC MShigh |
|
|---|
General Statistics
Number of major isoforms |
Number of additional isoforms |
Number of all proteins |
Number of amino acids |
Min. Seq. Length |
Max. Seq. Length |
Avg. Seq. Length |
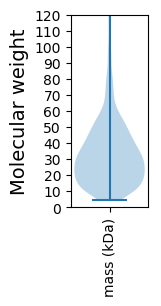
Avg. Mol. Weight |
|---|---|---|---|---|---|---|---|
0 |
491884 |
40 |
1636 |
320.9 |
34.59 |
Amino acid frequency
Ala |
Cys |
Asp |
Glu |
Phe |
Gly |
His |
Ile |
Lys |
Leu |
|---|---|---|---|---|---|---|---|---|---|
12.883 ± 0.097 | 0.759 ± 0.016 |
5.972 ± 0.054 | 6.494 ± 0.066 |
3.229 ± 0.038 | 8.753 ± 0.056 |
2.131 ± 0.026 | 4.525 ± 0.047 |
3.064 ± 0.047 | 9.406 ± 0.057 |
Met |
Asn |
Gln |
Pro |
Arg |
Ser |
Thr |
Val |
Trp |
Tyr |
|---|---|---|---|---|---|---|---|---|---|
2.014 ± 0.029 | 2.448 ± 0.03 |
5.18 ± 0.05 | 3.404 ± 0.034 |
6.873 ± 0.062 | 5.357 ± 0.035 |
5.665 ± 0.042 | 8.408 ± 0.061 |
1.323 ± 0.025 | 2.112 ± 0.033 |
Most of the basic statistics you can see at this page can be downloaded from this CSV file
See this proteome in:

Proteome-pI is available under Creative Commons Attribution-NoDerivs license, for more details see here
| Reference: Kozlowski LP. Proteome-pI 2.0: Proteome Isoelectric Point Database Update. Nucleic Acids Res. 2021, doi: 10.1093/nar/gkab944 | Contact: Lukasz P. Kozlowski |