Brochothrix phage NF5
Taxonomy: Viruses; Duplodnaviria; Heunggongvirae; Uroviricota; Caudoviricetes; Caudovirales; Siphoviridae; unclassified Siphoviridae
Average proteome isoelectric point is 6.58
Get precalculated fractions of proteins
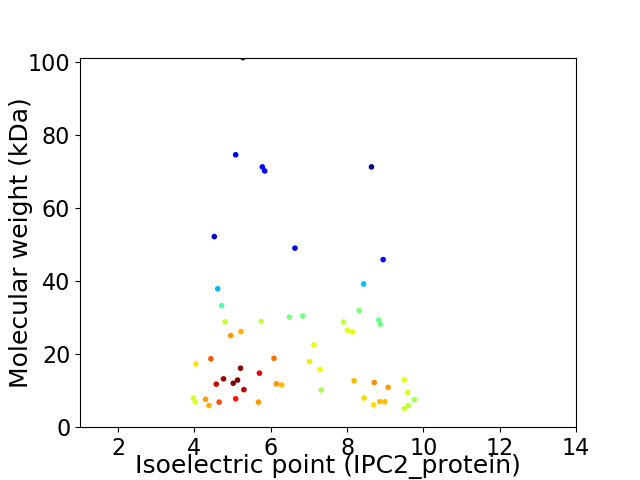
Virtual 2D-PAGE plot for 58 proteins (isoelectric point calculated using IPC2_protein)
Get csv file with sequences according to given criteria:
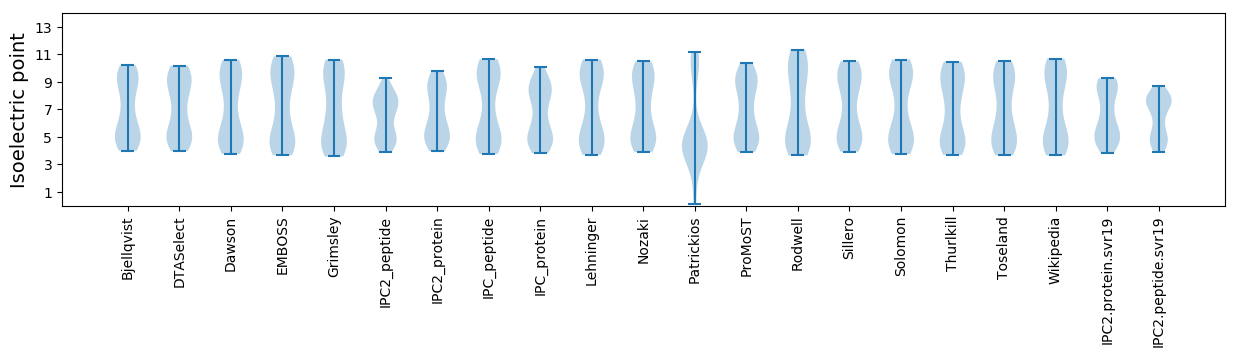
* You can choose from 21 different methods for calculating isoelectric point
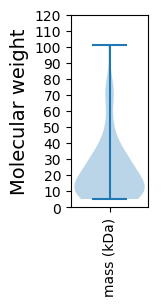
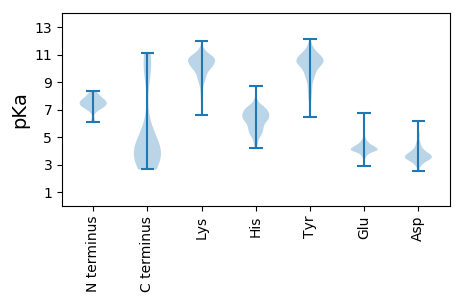
Summary statistics related to proteome-wise predictions
Protein with the lowest isoelectric point:
>tr|D7RWG5|D7RWG5_9CAUD Gp41 OS=Brochothrix phage NF5 OX=764561 PE=4 SV=1
MM1 pKa = 7.88EE2 pKa = 6.72DD3 pKa = 3.67YY4 pKa = 10.79DD5 pKa = 4.04CPKK8 pKa = 10.45CFEE11 pKa = 5.15CGDD14 pKa = 4.06EE15 pKa = 4.32CSMIDD20 pKa = 3.63GLLVCDD26 pKa = 4.66EE27 pKa = 4.25CTKK30 pKa = 10.61TYY32 pKa = 8.51TQQEE36 pKa = 4.19WEE38 pKa = 4.07QANEE42 pKa = 4.03KK43 pKa = 10.13EE44 pKa = 4.29LEE46 pKa = 3.98AFIAFLKK53 pKa = 10.27EE54 pKa = 3.79KK55 pKa = 10.45EE56 pKa = 4.37SAQGG60 pKa = 3.21
MM1 pKa = 7.88EE2 pKa = 6.72DD3 pKa = 3.67YY4 pKa = 10.79DD5 pKa = 4.04CPKK8 pKa = 10.45CFEE11 pKa = 5.15CGDD14 pKa = 4.06EE15 pKa = 4.32CSMIDD20 pKa = 3.63GLLVCDD26 pKa = 4.66EE27 pKa = 4.25CTKK30 pKa = 10.61TYY32 pKa = 8.51TQQEE36 pKa = 4.19WEE38 pKa = 4.07QANEE42 pKa = 4.03KK43 pKa = 10.13EE44 pKa = 4.29LEE46 pKa = 3.98AFIAFLKK53 pKa = 10.27EE54 pKa = 3.79KK55 pKa = 10.45EE56 pKa = 4.37SAQGG60 pKa = 3.21
Molecular weight: 6.92 kDa
Isoelectric point according different methods:
Protein with the highest isoelectric point:
>tr|D7RWH9|D7RWH9_9CAUD Gp53 OS=Brochothrix phage NF5 OX=764561 PE=4 SV=1
MM1 pKa = 7.19QSFVSIDD8 pKa = 3.54LKK10 pKa = 10.48QQLSIFKK17 pKa = 10.46HH18 pKa = 5.43SLICNRR24 pKa = 11.84KK25 pKa = 9.13AYY27 pKa = 10.65LLLKK31 pKa = 9.8VCFFVGIFIRR41 pKa = 11.84GRR43 pKa = 3.3
MM1 pKa = 7.19QSFVSIDD8 pKa = 3.54LKK10 pKa = 10.48QQLSIFKK17 pKa = 10.46HH18 pKa = 5.43SLICNRR24 pKa = 11.84KK25 pKa = 9.13AYY27 pKa = 10.65LLLKK31 pKa = 9.8VCFFVGIFIRR41 pKa = 11.84GRR43 pKa = 3.3
Molecular weight: 5.06 kDa
Isoelectric point according different methods:
Peptides (in silico digests for buttom-up proteomics)
Below you can find in silico digests of the whole proteome with Trypsin, Chymotrypsin, Trypsin+LysC, LysN, ArgC proteases suitable for different mass spec machines.| Try ESI |
 |
|---|
| ChTry ESI |
|
|---|
| ArgC ESI |
|
|---|
| LysN ESI |
|
|---|
| TryLysC ESI |
|
|---|
| Try MALDI |
|
|---|
| ChTry MALDI |
|
|---|
| ArgC MALDI |
|
|---|
| LysN MALDI |
|
|---|
| TryLysC MALDI |
|
|---|
| Try LTQ |
|
|---|
| ChTry LTQ |
|
|---|
| ArgC LTQ |
|
|---|
| LysN LTQ |
|
|---|
| TryLysC LTQ |
|
|---|
| Try MSlow |
|
|---|
| ChTry MSlow |
|
|---|
| ArgC MSlow |
|
|---|
| LysN MSlow |
|
|---|
| TryLysC MSlow |
|
|---|
| Try MShigh |
|
|---|
| ChTry MShigh |
|
|---|
| ArgC MShigh |
|
|---|
| LysN MShigh |
|
|---|
| TryLysC MShigh |
|
|---|
General Statistics
Number of major isoforms |
Number of additional isoforms |
Number of all proteins |
Number of amino acids |
Min. Seq. Length |
Max. Seq. Length |
Avg. Seq. Length |
Avg. Mol. Weight |
|---|---|---|---|---|---|---|---|
0 |
12189 |
43 |
915 |
210.2 |
23.75 |
Amino acid frequency
Ala |
Cys |
Asp |
Glu |
Phe |
Gly |
His |
Ile |
Lys |
Leu |
|---|---|---|---|---|---|---|---|---|---|
6.637 ± 0.376 | 0.755 ± 0.124 |
6.563 ± 0.198 | 7.384 ± 0.461 |
4.283 ± 0.239 | 6.202 ± 0.552 |
1.477 ± 0.183 | 7.039 ± 0.283 |
9.303 ± 0.346 | 7.827 ± 0.331 |
Met |
Asn |
Gln |
Pro |
Arg |
Ser |
Thr |
Val |
Trp |
Tyr |
|---|---|---|---|---|---|---|---|---|---|
2.387 ± 0.175 | 5.694 ± 0.224 |
2.609 ± 0.217 | 3.774 ± 0.201 |
3.823 ± 0.24 | 6.194 ± 0.275 |
6.506 ± 0.357 | 6.727 ± 0.26 |
1.05 ± 0.118 | 3.766 ± 0.211 |
Most of the basic statistics you can see at this page can be downloaded from this CSV file
See this proteome in:

Proteome-pI is available under Creative Commons Attribution-NoDerivs license, for more details see here
| Reference: Kozlowski LP. Proteome-pI 2.0: Proteome Isoelectric Point Database Update. Nucleic Acids Res. 2021, doi: 10.1093/nar/gkab944 | Contact: Lukasz P. Kozlowski |