Paenibacillus rigui
Taxonomy: cellular organisms; Bacteria; Terrabacteria group; Firmicutes; Bacilli; Bacillales; Paenibacillaceae; Paenibacillus
Average proteome isoelectric point is 6.43
Get precalculated fractions of proteins
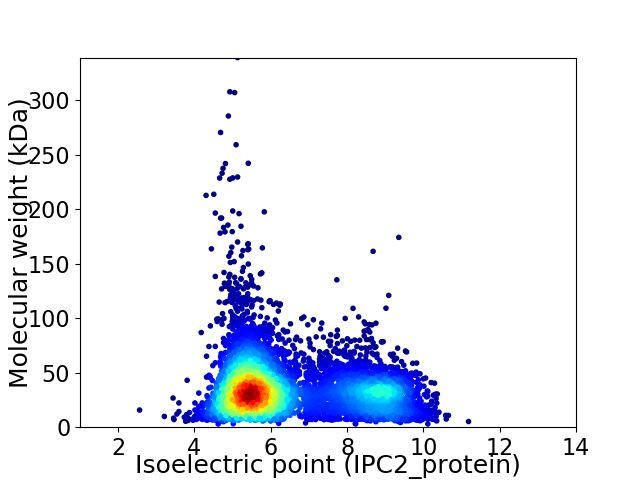
Virtual 2D-PAGE plot for 6159 proteins (isoelectric point calculated using IPC2_protein)
Get csv file with sequences according to given criteria:
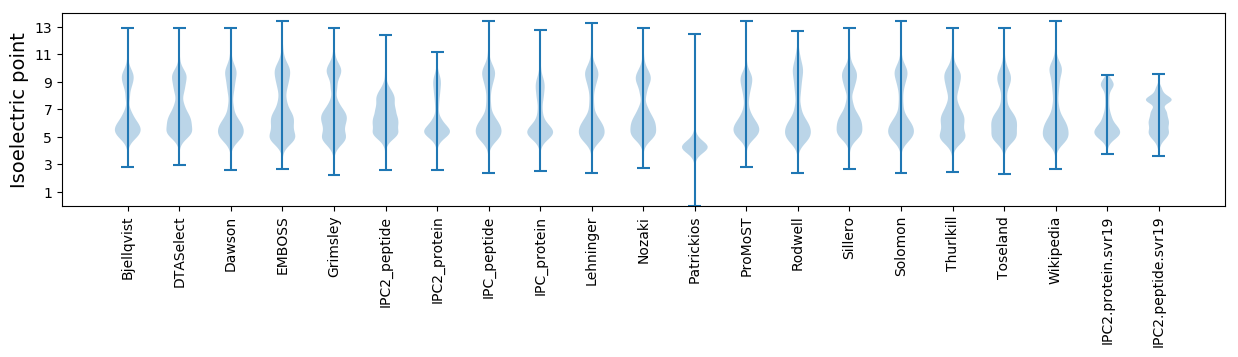
* You can choose from 21 different methods for calculating isoelectric point
Summary statistics related to proteome-wise predictions
Protein with the lowest isoelectric point:
>tr|A0A229UKA0|A0A229UKA0_9BACL Aspartate ammonia-lyase OS=Paenibacillus rigui OX=554312 GN=aspA PE=3 SV=1
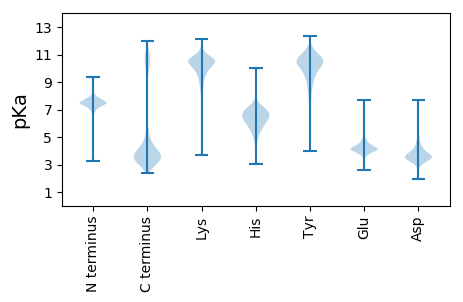
MM1 pKa = 7.07YY2 pKa = 10.54KK3 pKa = 10.39EE4 pKa = 4.27IADD7 pKa = 4.05EE8 pKa = 4.85DD9 pKa = 5.53LIDD12 pKa = 4.63CYY14 pKa = 11.7VNAVQMQLDD23 pKa = 3.93TDD25 pKa = 4.22FLGLLLYY32 pKa = 11.08AMEE35 pKa = 4.08QRR37 pKa = 11.84NLRR40 pKa = 11.84VSEE43 pKa = 3.9EE44 pKa = 3.93DD45 pKa = 4.97LYY47 pKa = 11.31FQYY50 pKa = 11.21KK51 pKa = 10.39LEE53 pKa = 4.11
MM1 pKa = 7.07YY2 pKa = 10.54KK3 pKa = 10.39EE4 pKa = 4.27IADD7 pKa = 4.05EE8 pKa = 4.85DD9 pKa = 5.53LIDD12 pKa = 4.63CYY14 pKa = 11.7VNAVQMQLDD23 pKa = 3.93TDD25 pKa = 4.22FLGLLLYY32 pKa = 11.08AMEE35 pKa = 4.08QRR37 pKa = 11.84NLRR40 pKa = 11.84VSEE43 pKa = 3.9EE44 pKa = 3.93DD45 pKa = 4.97LYY47 pKa = 11.31FQYY50 pKa = 11.21KK51 pKa = 10.39LEE53 pKa = 4.11
Molecular weight: 6.4 kDa
Isoelectric point according different methods:
Protein with the highest isoelectric point:
>tr|A0A229UP62|A0A229UP62_9BACL Cobalt ABC transporter ATP-binding protein OS=Paenibacillus rigui OX=554312 GN=CF651_16180 PE=4 SV=1
MM1 pKa = 7.9RR2 pKa = 11.84PTFKK6 pKa = 10.87PNVRR10 pKa = 11.84KK11 pKa = 9.84RR12 pKa = 11.84KK13 pKa = 8.89KK14 pKa = 8.64VHH16 pKa = 5.57GFRR19 pKa = 11.84KK20 pKa = 10.01RR21 pKa = 11.84MSTKK25 pKa = 10.18NGRR28 pKa = 11.84KK29 pKa = 8.87VLAARR34 pKa = 11.84RR35 pKa = 11.84LKK37 pKa = 10.2GRR39 pKa = 11.84KK40 pKa = 8.79VLSAA44 pKa = 4.05
MM1 pKa = 7.9RR2 pKa = 11.84PTFKK6 pKa = 10.87PNVRR10 pKa = 11.84KK11 pKa = 9.84RR12 pKa = 11.84KK13 pKa = 8.89KK14 pKa = 8.64VHH16 pKa = 5.57GFRR19 pKa = 11.84KK20 pKa = 10.01RR21 pKa = 11.84MSTKK25 pKa = 10.18NGRR28 pKa = 11.84KK29 pKa = 8.87VLAARR34 pKa = 11.84RR35 pKa = 11.84LKK37 pKa = 10.2GRR39 pKa = 11.84KK40 pKa = 8.79VLSAA44 pKa = 4.05
Molecular weight: 5.19 kDa
Isoelectric point according different methods:
Peptides (in silico digests for buttom-up proteomics)
Below you can find in silico digests of the whole proteome with Trypsin, Chymotrypsin, Trypsin+LysC, LysN, ArgC proteases suitable for different mass spec machines.| Try ESI |
 |
|---|
| ChTry ESI |
|
|---|
| ArgC ESI |
|
|---|
| LysN ESI |
|
|---|
| TryLysC ESI |
|
|---|
| Try MALDI |
|
|---|
| ChTry MALDI |
|
|---|
| ArgC MALDI |
|
|---|
| LysN MALDI |
|
|---|
| TryLysC MALDI |
|
|---|
| Try LTQ |
|
|---|
| ChTry LTQ |
|
|---|
| ArgC LTQ |
|
|---|
| LysN LTQ |
|
|---|
| TryLysC LTQ |
|
|---|
| Try MSlow |
|
|---|
| ChTry MSlow |
|
|---|
| ArgC MSlow |
|
|---|
| LysN MSlow |
|
|---|
| TryLysC MSlow |
|
|---|
| Try MShigh |
|
|---|
| ChTry MShigh |
|
|---|
| ArgC MShigh |
|
|---|
| LysN MShigh |
|
|---|
| TryLysC MShigh |
|
|---|
General Statistics
Number of major isoforms |
Number of additional isoforms |
Number of all proteins |
Number of amino acids |
Min. Seq. Length |
Max. Seq. Length |
Avg. Seq. Length |
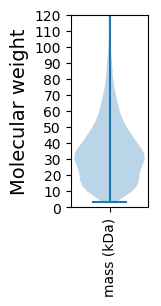
Avg. Mol. Weight |
|---|---|---|---|---|---|---|---|
0 |
2066054 |
26 |
3348 |
335.5 |
37.35 |
Amino acid frequency
Ala |
Cys |
Asp |
Glu |
Phe |
Gly |
His |
Ile |
Lys |
Leu |
|---|---|---|---|---|---|---|---|---|---|
8.393 ± 0.037 | 0.767 ± 0.009 |
5.014 ± 0.022 | 6.456 ± 0.037 |
4.056 ± 0.023 | 7.39 ± 0.035 |
2.203 ± 0.017 | 6.411 ± 0.029 |
5.394 ± 0.035 | 10.093 ± 0.04 |
Met |
Asn |
Gln |
Pro |
Arg |
Ser |
Thr |
Val |
Trp |
Tyr |
|---|---|---|---|---|---|---|---|---|---|
2.792 ± 0.019 | 3.737 ± 0.028 |
4.187 ± 0.022 | 4.266 ± 0.023 |
4.936 ± 0.029 | 6.399 ± 0.03 |
5.551 ± 0.031 | 7.102 ± 0.025 |
1.34 ± 0.013 | 3.514 ± 0.018 |
Most of the basic statistics you can see at this page can be downloaded from this CSV file
See this proteome in:

Proteome-pI is available under Creative Commons Attribution-NoDerivs license, for more details see here
| Reference: Kozlowski LP. Proteome-pI 2.0: Proteome Isoelectric Point Database Update. Nucleic Acids Res. 2021, doi: 10.1093/nar/gkab944 | Contact: Lukasz P. Kozlowski |