Achromobacter piechaudii ATCC 43553
Taxonomy: cellular organisms; Bacteria; Proteobacteria; Betaproteobacteria; Burkholderiales; Alcaligenaceae; Achromobacter; Achromobacter piechaudii
Average proteome isoelectric point is 6.84
Get precalculated fractions of proteins
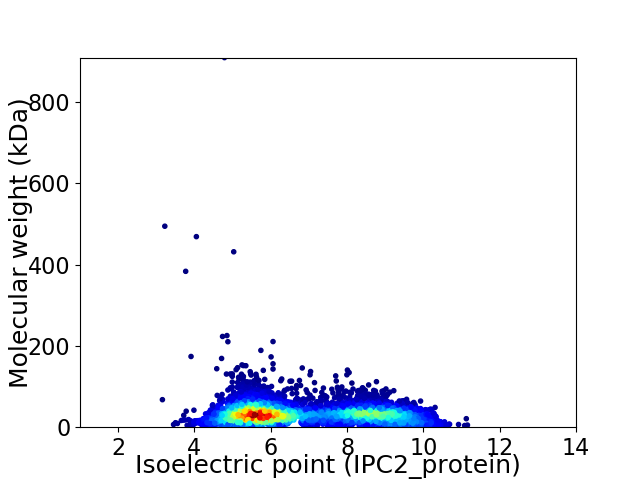
Virtual 2D-PAGE plot for 5755 proteins (isoelectric point calculated using IPC2_protein)
Get csv file with sequences according to given criteria:
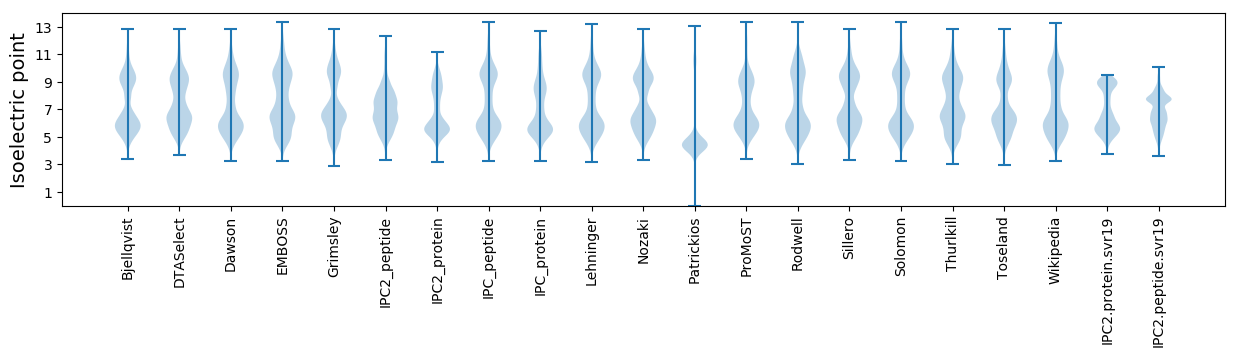
* You can choose from 21 different methods for calculating isoelectric point
Summary statistics related to proteome-wise predictions
Protein with the lowest isoelectric point:
>tr|D4XJT6|D4XJT6_9BURK VCBS repeat (3 repeats) (Fragment) OS=Achromobacter piechaudii ATCC 43553 OX=742159 GN=HMPREF0004_5733 PE=4 SV=1
MM1 pKa = 6.98FAAAEE6 pKa = 4.04PDD8 pKa = 3.17IDD10 pKa = 3.89EE11 pKa = 4.82AGCFFRR17 pKa = 11.84CPGCDD22 pKa = 3.48HH23 pKa = 6.98RR24 pKa = 11.84NKK26 pKa = 10.37LINVGPYY33 pKa = 10.32GDD35 pKa = 4.88EE36 pKa = 4.28DD37 pKa = 5.86PITLGQPDD45 pKa = 3.84DD46 pKa = 3.71
MM1 pKa = 6.98FAAAEE6 pKa = 4.04PDD8 pKa = 3.17IDD10 pKa = 3.89EE11 pKa = 4.82AGCFFRR17 pKa = 11.84CPGCDD22 pKa = 3.48HH23 pKa = 6.98RR24 pKa = 11.84NKK26 pKa = 10.37LINVGPYY33 pKa = 10.32GDD35 pKa = 4.88EE36 pKa = 4.28DD37 pKa = 5.86PITLGQPDD45 pKa = 3.84DD46 pKa = 3.71
Molecular weight: 5.01 kDa
Isoelectric point according different methods:
Protein with the highest isoelectric point:
>tr|D4X3F8|D4X3F8_9BURK ATPase family associated with various cellular activities (AAA) (Fragment) OS=Achromobacter piechaudii ATCC 43553 OX=742159 GN=HMPREF0004_0005 PE=3 SV=1
NN1 pKa = 7.35APSRR5 pKa = 11.84PASLQRR11 pKa = 11.84SSTMSRR17 pKa = 11.84TAAAARR23 pKa = 11.84GSPTTSPRR31 pKa = 11.84RR32 pKa = 11.84TRR34 pKa = 11.84RR35 pKa = 11.84KK36 pKa = 9.03MGPP39 pKa = 3.07
NN1 pKa = 7.35APSRR5 pKa = 11.84PASLQRR11 pKa = 11.84SSTMSRR17 pKa = 11.84TAAAARR23 pKa = 11.84GSPTTSPRR31 pKa = 11.84RR32 pKa = 11.84TRR34 pKa = 11.84RR35 pKa = 11.84KK36 pKa = 9.03MGPP39 pKa = 3.07
Molecular weight: 4.15 kDa
Isoelectric point according different methods:
Peptides (in silico digests for buttom-up proteomics)
Below you can find in silico digests of the whole proteome with Trypsin, Chymotrypsin, Trypsin+LysC, LysN, ArgC proteases suitable for different mass spec machines.| Try ESI |
 |
|---|
| ChTry ESI |
|
|---|
| ArgC ESI |
|
|---|
| LysN ESI |
|
|---|
| TryLysC ESI |
|
|---|
| Try MALDI |
|
|---|
| ChTry MALDI |
|
|---|
| ArgC MALDI |
|
|---|
| LysN MALDI |
|
|---|
| TryLysC MALDI |
|
|---|
| Try LTQ |
|
|---|
| ChTry LTQ |
|
|---|
| ArgC LTQ |
|
|---|
| LysN LTQ |
|
|---|
| TryLysC LTQ |
|
|---|
| Try MSlow |
|
|---|
| ChTry MSlow |
|
|---|
| ArgC MSlow |
|
|---|
| LysN MSlow |
|
|---|
| TryLysC MSlow |
|
|---|
| Try MShigh |
|
|---|
| ChTry MShigh |
|
|---|
| ArgC MShigh |
|
|---|
| LysN MShigh |
|
|---|
| TryLysC MShigh |
|
|---|
General Statistics
Number of major isoforms |
Number of additional isoforms |
Number of all proteins |
Number of amino acids |
Min. Seq. Length |
Max. Seq. Length |
Avg. Seq. Length |
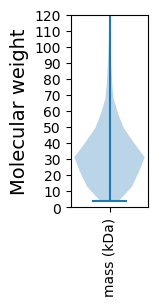
Avg. Mol. Weight |
|---|---|---|---|---|---|---|---|
0 |
1831974 |
39 |
9024 |
318.3 |
34.45 |
Amino acid frequency
Ala |
Cys |
Asp |
Glu |
Phe |
Gly |
His |
Ile |
Lys |
Leu |
|---|---|---|---|---|---|---|---|---|---|
12.896 ± 0.046 | 0.88 ± 0.01 |
5.482 ± 0.031 | 4.814 ± 0.036 |
3.391 ± 0.026 | 8.47 ± 0.049 |
2.119 ± 0.016 | 4.487 ± 0.023 |
2.988 ± 0.026 | 10.639 ± 0.051 |
Met |
Asn |
Gln |
Pro |
Arg |
Ser |
Thr |
Val |
Trp |
Tyr |
|---|---|---|---|---|---|---|---|---|---|
2.568 ± 0.02 | 2.718 ± 0.028 |
5.317 ± 0.033 | 3.959 ± 0.02 |
6.884 ± 0.041 | 5.525 ± 0.039 |
5.318 ± 0.052 | 7.706 ± 0.031 |
1.418 ± 0.017 | 2.423 ± 0.017 |
Most of the basic statistics you can see at this page can be downloaded from this CSV file
See this proteome in:

Proteome-pI is available under Creative Commons Attribution-NoDerivs license, for more details see here
| Reference: Kozlowski LP. Proteome-pI 2.0: Proteome Isoelectric Point Database Update. Nucleic Acids Res. 2021, doi: 10.1093/nar/gkab944 | Contact: Lukasz P. Kozlowski |