Butyrivibrio sp. M55
Taxonomy: cellular organisms; Bacteria; Terrabacteria group; Firmicutes; Clostridia; Eubacteriales; Lachnospiraceae; Butyrivibrio; unclassified Butyrivibrio
Average proteome isoelectric point is 5.88
Get precalculated fractions of proteins
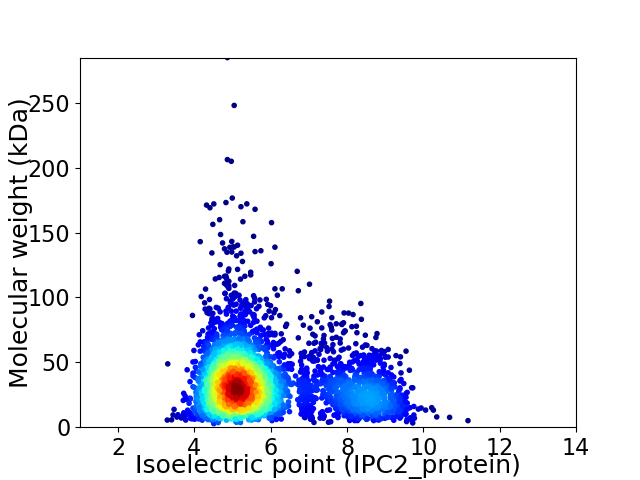
Virtual 2D-PAGE plot for 3341 proteins (isoelectric point calculated using IPC2_protein)
Get csv file with sequences according to given criteria:
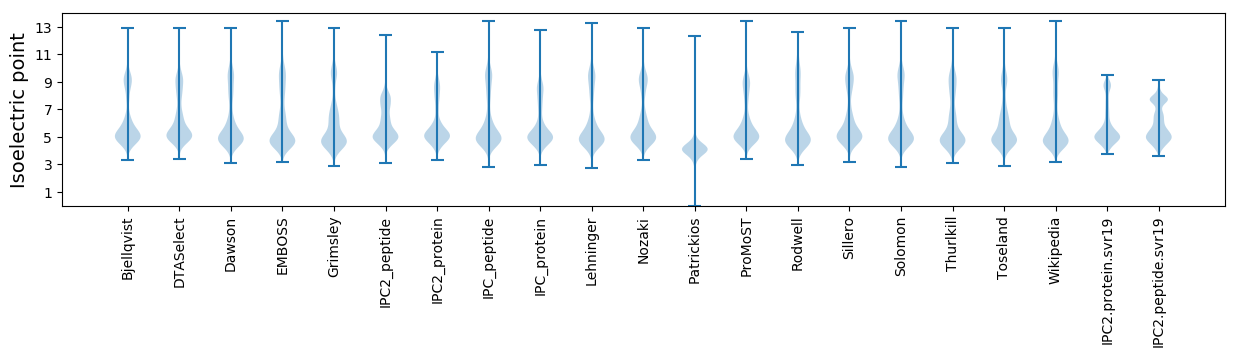
* You can choose from 21 different methods for calculating isoelectric point
Summary statistics related to proteome-wise predictions
Protein with the lowest isoelectric point:
>tr|A0A1I7JBP5|A0A1I7JBP5_9FIRM 3-methyladenine DNA glycosylase AlkD OS=Butyrivibrio sp. M55 OX=1855323 GN=SAMN05216540_11224 PE=4 SV=1
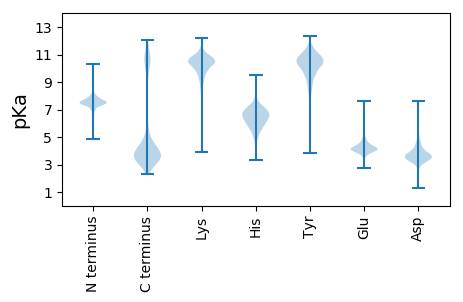
MM1 pKa = 7.38KK2 pKa = 10.46RR3 pKa = 11.84NIALVLTCLMIIGMVGCVGNDD24 pKa = 3.11KK25 pKa = 11.21AQDD28 pKa = 3.57SEE30 pKa = 4.82NIGGANDD37 pKa = 3.47AASNEE42 pKa = 4.23LEE44 pKa = 4.26TTSAGDD50 pKa = 3.26EE51 pKa = 4.14AQAAEE56 pKa = 4.31AASEE60 pKa = 4.08QATAADD66 pKa = 4.93DD67 pKa = 5.35DD68 pKa = 4.12FTPYY72 pKa = 11.0QLFLSDD78 pKa = 4.85DD79 pKa = 4.04LSVDD83 pKa = 3.01GQTFLEE89 pKa = 5.03IYY91 pKa = 10.64AEE93 pKa = 4.16SFDD96 pKa = 4.95DD97 pKa = 5.03LGEE100 pKa = 4.25KK101 pKa = 10.25PEE103 pKa = 4.01AYY105 pKa = 10.26YY106 pKa = 11.24YY107 pKa = 10.99DD108 pKa = 3.79VDD110 pKa = 4.61SDD112 pKa = 4.93GEE114 pKa = 4.29DD115 pKa = 3.37EE116 pKa = 4.67LLVVGPYY123 pKa = 10.35YY124 pKa = 11.01GFDD127 pKa = 3.08IYY129 pKa = 11.58DD130 pKa = 3.71VINGEE135 pKa = 4.55FTCLDD140 pKa = 3.87CGGGIATICDD150 pKa = 3.41IYY152 pKa = 11.2AGEE155 pKa = 4.08GKK157 pKa = 10.43AYY159 pKa = 10.11VVHH162 pKa = 6.86TDD164 pKa = 4.02FGHH167 pKa = 6.45VGRR170 pKa = 11.84QNIEE174 pKa = 3.59FALYY178 pKa = 10.09GSNGEE183 pKa = 4.13KK184 pKa = 10.45VEE186 pKa = 4.12SFEE189 pKa = 4.84ISAGYY194 pKa = 8.69PDD196 pKa = 4.6KK197 pKa = 11.48DD198 pKa = 3.62NYY200 pKa = 11.11DD201 pKa = 3.89EE202 pKa = 5.68NSMFLLNDD210 pKa = 3.51KK211 pKa = 10.01EE212 pKa = 4.28ITMQEE217 pKa = 3.92YY218 pKa = 9.97EE219 pKa = 4.74KK220 pKa = 11.15YY221 pKa = 10.58LNTYY225 pKa = 9.52KK226 pKa = 10.83PLDD229 pKa = 3.75RR230 pKa = 11.84STLKK234 pKa = 10.86SAWDD238 pKa = 3.37
MM1 pKa = 7.38KK2 pKa = 10.46RR3 pKa = 11.84NIALVLTCLMIIGMVGCVGNDD24 pKa = 3.11KK25 pKa = 11.21AQDD28 pKa = 3.57SEE30 pKa = 4.82NIGGANDD37 pKa = 3.47AASNEE42 pKa = 4.23LEE44 pKa = 4.26TTSAGDD50 pKa = 3.26EE51 pKa = 4.14AQAAEE56 pKa = 4.31AASEE60 pKa = 4.08QATAADD66 pKa = 4.93DD67 pKa = 5.35DD68 pKa = 4.12FTPYY72 pKa = 11.0QLFLSDD78 pKa = 4.85DD79 pKa = 4.04LSVDD83 pKa = 3.01GQTFLEE89 pKa = 5.03IYY91 pKa = 10.64AEE93 pKa = 4.16SFDD96 pKa = 4.95DD97 pKa = 5.03LGEE100 pKa = 4.25KK101 pKa = 10.25PEE103 pKa = 4.01AYY105 pKa = 10.26YY106 pKa = 11.24YY107 pKa = 10.99DD108 pKa = 3.79VDD110 pKa = 4.61SDD112 pKa = 4.93GEE114 pKa = 4.29DD115 pKa = 3.37EE116 pKa = 4.67LLVVGPYY123 pKa = 10.35YY124 pKa = 11.01GFDD127 pKa = 3.08IYY129 pKa = 11.58DD130 pKa = 3.71VINGEE135 pKa = 4.55FTCLDD140 pKa = 3.87CGGGIATICDD150 pKa = 3.41IYY152 pKa = 11.2AGEE155 pKa = 4.08GKK157 pKa = 10.43AYY159 pKa = 10.11VVHH162 pKa = 6.86TDD164 pKa = 4.02FGHH167 pKa = 6.45VGRR170 pKa = 11.84QNIEE174 pKa = 3.59FALYY178 pKa = 10.09GSNGEE183 pKa = 4.13KK184 pKa = 10.45VEE186 pKa = 4.12SFEE189 pKa = 4.84ISAGYY194 pKa = 8.69PDD196 pKa = 4.6KK197 pKa = 11.48DD198 pKa = 3.62NYY200 pKa = 11.11DD201 pKa = 3.89EE202 pKa = 5.68NSMFLLNDD210 pKa = 3.51KK211 pKa = 10.01EE212 pKa = 4.28ITMQEE217 pKa = 3.92YY218 pKa = 9.97EE219 pKa = 4.74KK220 pKa = 11.15YY221 pKa = 10.58LNTYY225 pKa = 9.52KK226 pKa = 10.83PLDD229 pKa = 3.75RR230 pKa = 11.84STLKK234 pKa = 10.86SAWDD238 pKa = 3.37
Molecular weight: 26.13 kDa
Isoelectric point according different methods:
Protein with the highest isoelectric point:
>tr|A0A1I7GZN7|A0A1I7GZN7_9FIRM Exodeoxyribonuclease III OS=Butyrivibrio sp. M55 OX=1855323 GN=SAMN05216540_103223 PE=3 SV=1
MM1 pKa = 7.58KK2 pKa = 8.74MTFQPHH8 pKa = 5.93KK9 pKa = 8.68LQRR12 pKa = 11.84ARR14 pKa = 11.84VHH16 pKa = 6.17GFRR19 pKa = 11.84ARR21 pKa = 11.84MATKK25 pKa = 10.36GGRR28 pKa = 11.84KK29 pKa = 8.97VLAARR34 pKa = 11.84RR35 pKa = 11.84AKK37 pKa = 9.92GRR39 pKa = 11.84KK40 pKa = 8.91RR41 pKa = 11.84LSAA44 pKa = 3.96
MM1 pKa = 7.58KK2 pKa = 8.74MTFQPHH8 pKa = 5.93KK9 pKa = 8.68LQRR12 pKa = 11.84ARR14 pKa = 11.84VHH16 pKa = 6.17GFRR19 pKa = 11.84ARR21 pKa = 11.84MATKK25 pKa = 10.36GGRR28 pKa = 11.84KK29 pKa = 8.97VLAARR34 pKa = 11.84RR35 pKa = 11.84AKK37 pKa = 9.92GRR39 pKa = 11.84KK40 pKa = 8.91RR41 pKa = 11.84LSAA44 pKa = 3.96
Molecular weight: 5.06 kDa
Isoelectric point according different methods:
Peptides (in silico digests for buttom-up proteomics)
Below you can find in silico digests of the whole proteome with Trypsin, Chymotrypsin, Trypsin+LysC, LysN, ArgC proteases suitable for different mass spec machines.| Try ESI |
 |
|---|
| ChTry ESI |
|
|---|
| ArgC ESI |
|
|---|
| LysN ESI |
|
|---|
| TryLysC ESI |
|
|---|
| Try MALDI |
|
|---|
| ChTry MALDI |
|
|---|
| ArgC MALDI |
|
|---|
| LysN MALDI |
|
|---|
| TryLysC MALDI |
|
|---|
| Try LTQ |
|
|---|
| ChTry LTQ |
|
|---|
| ArgC LTQ |
|
|---|
| LysN LTQ |
|
|---|
| TryLysC LTQ |
|
|---|
| Try MSlow |
|
|---|
| ChTry MSlow |
|
|---|
| ArgC MSlow |
|
|---|
| LysN MSlow |
|
|---|
| TryLysC MSlow |
|
|---|
| Try MShigh |
|
|---|
| ChTry MShigh |
|
|---|
| ArgC MShigh |
|
|---|
| LysN MShigh |
|
|---|
| TryLysC MShigh |
|
|---|
General Statistics
Number of major isoforms |
Number of additional isoforms |
Number of all proteins |
Number of amino acids |
Min. Seq. Length |
Max. Seq. Length |
Avg. Seq. Length |
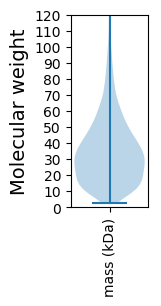
Avg. Mol. Weight |
|---|---|---|---|---|---|---|---|
0 |
1100749 |
25 |
2500 |
329.5 |
36.98 |
Amino acid frequency
Ala |
Cys |
Asp |
Glu |
Phe |
Gly |
His |
Ile |
Lys |
Leu |
|---|---|---|---|---|---|---|---|---|---|
7.24 ± 0.039 | 1.392 ± 0.016 |
6.527 ± 0.035 | 7.453 ± 0.048 |
4.374 ± 0.035 | 6.843 ± 0.034 |
1.527 ± 0.017 | 7.878 ± 0.043 |
7.634 ± 0.038 | 8.246 ± 0.039 |
Met |
Asn |
Gln |
Pro |
Arg |
Ser |
Thr |
Val |
Trp |
Tyr |
|---|---|---|---|---|---|---|---|---|---|
2.985 ± 0.02 | 4.916 ± 0.03 |
2.997 ± 0.024 | 2.538 ± 0.025 |
3.917 ± 0.033 | 6.241 ± 0.032 |
5.177 ± 0.029 | 6.923 ± 0.036 |
0.82 ± 0.013 | 4.371 ± 0.032 |
Most of the basic statistics you can see at this page can be downloaded from this CSV file
See this proteome in:

Proteome-pI is available under Creative Commons Attribution-NoDerivs license, for more details see here
| Reference: Kozlowski LP. Proteome-pI 2.0: Proteome Isoelectric Point Database Update. Nucleic Acids Res. 2021, doi: 10.1093/nar/gkab944 | Contact: Lukasz P. Kozlowski |