Pseudomonas syringae pv. tomato (strain ATCC BAA-871 / DC3000)
Taxonomy: cellular organisms; Bacteria; Proteobacteria; Gammaproteobacteria; Pseudomonadales; Pseudomonadaceae; Pseudomonas; Pseudomonas syringae group; Pseudomonas syringae group genomosp. 3; Pseudomonas syringae pv. tomato
Average proteome isoelectric point is 6.46
Get precalculated fractions of proteins
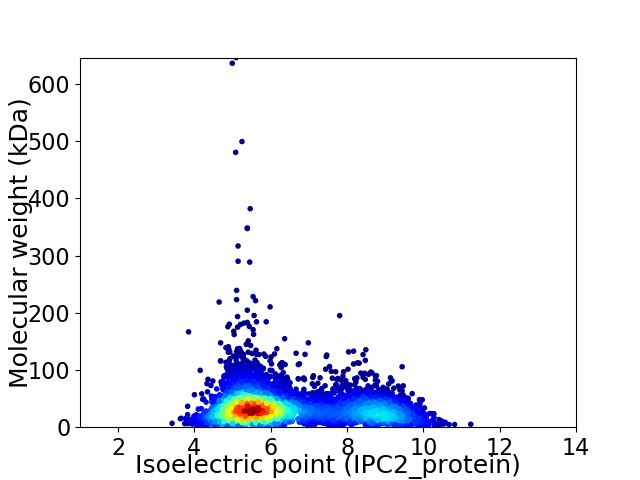
Virtual 2D-PAGE plot for 5431 proteins (isoelectric point calculated using IPC2_protein)
Get csv file with sequences according to given criteria:
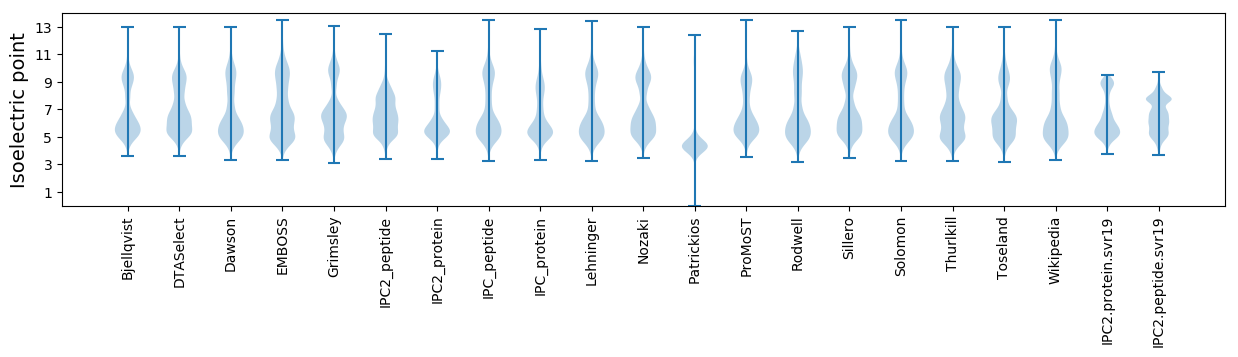
* You can choose from 21 different methods for calculating isoelectric point
Summary statistics related to proteome-wise predictions
Protein with the lowest isoelectric point:
>tr|Q87U77|Q87U77_PSESM GPW_gp25 domain-containing protein OS=Pseudomonas syringae pv. tomato (strain ATCC BAA-871 / DC3000) OX=223283 GN=PSPTO_5431 PE=4 SV=1
MM1 pKa = 6.8QWAAVQFFTATATGICDD18 pKa = 3.92LMKK21 pKa = 10.81CVDD24 pKa = 4.66LSCTILQLRR33 pKa = 11.84TTSTADD39 pKa = 3.36NADD42 pKa = 3.73SPDD45 pKa = 3.23AAIAINN51 pKa = 3.48
MM1 pKa = 6.8QWAAVQFFTATATGICDD18 pKa = 3.92LMKK21 pKa = 10.81CVDD24 pKa = 4.66LSCTILQLRR33 pKa = 11.84TTSTADD39 pKa = 3.36NADD42 pKa = 3.73SPDD45 pKa = 3.23AAIAINN51 pKa = 3.48
Molecular weight: 5.41 kDa
Isoelectric point according different methods:
Protein with the highest isoelectric point:
>tr|Q87TX6|Q87TX6_PSESM Phosphatidate cytidylyltransferase OS=Pseudomonas syringae pv. tomato (strain ATCC BAA-871 / DC3000) OX=223283 GN=cdsA-2 PE=4 SV=1
MM1 pKa = 7.45KK2 pKa = 9.56RR3 pKa = 11.84TFQPSTIKK11 pKa = 10.52RR12 pKa = 11.84ARR14 pKa = 11.84THH16 pKa = 5.94GFRR19 pKa = 11.84ARR21 pKa = 11.84MATKK25 pKa = 10.16NGRR28 pKa = 11.84AVLSRR33 pKa = 11.84RR34 pKa = 11.84RR35 pKa = 11.84AKK37 pKa = 9.94GRR39 pKa = 11.84KK40 pKa = 8.66RR41 pKa = 11.84LAVV44 pKa = 3.41
MM1 pKa = 7.45KK2 pKa = 9.56RR3 pKa = 11.84TFQPSTIKK11 pKa = 10.52RR12 pKa = 11.84ARR14 pKa = 11.84THH16 pKa = 5.94GFRR19 pKa = 11.84ARR21 pKa = 11.84MATKK25 pKa = 10.16NGRR28 pKa = 11.84AVLSRR33 pKa = 11.84RR34 pKa = 11.84RR35 pKa = 11.84AKK37 pKa = 9.94GRR39 pKa = 11.84KK40 pKa = 8.66RR41 pKa = 11.84LAVV44 pKa = 3.41
Molecular weight: 5.12 kDa
Isoelectric point according different methods:
Peptides (in silico digests for buttom-up proteomics)
Below you can find in silico digests of the whole proteome with Trypsin, Chymotrypsin, Trypsin+LysC, LysN, ArgC proteases suitable for different mass spec machines.| Try ESI |
 |
|---|
| ChTry ESI |
|
|---|
| ArgC ESI |
|
|---|
| LysN ESI |
|
|---|
| TryLysC ESI |
|
|---|
| Try MALDI |
|
|---|
| ChTry MALDI |
|
|---|
| ArgC MALDI |
|
|---|
| LysN MALDI |
|
|---|
| TryLysC MALDI |
|
|---|
| Try LTQ |
|
|---|
| ChTry LTQ |
|
|---|
| ArgC LTQ |
|
|---|
| LysN LTQ |
|
|---|
| TryLysC LTQ |
|
|---|
| Try MSlow |
|
|---|
| ChTry MSlow |
|
|---|
| ArgC MSlow |
|
|---|
| LysN MSlow |
|
|---|
| TryLysC MSlow |
|
|---|
| Try MShigh |
|
|---|
| ChTry MShigh |
|
|---|
| ArgC MShigh |
|
|---|
| LysN MShigh |
|
|---|
| TryLysC MShigh |
|
|---|
General Statistics
Number of major isoforms |
Number of additional isoforms |
Number of all proteins |
Number of amino acids |
Min. Seq. Length |
Max. Seq. Length |
Avg. Seq. Length |
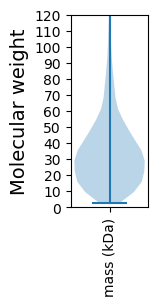
Avg. Mol. Weight |
|---|---|---|---|---|---|---|---|
0 |
1794801 |
24 |
6274 |
330.5 |
36.28 |
Amino acid frequency
Ala |
Cys |
Asp |
Glu |
Phe |
Gly |
His |
Ile |
Lys |
Leu |
|---|---|---|---|---|---|---|---|---|---|
10.665 ± 0.039 | 0.981 ± 0.012 |
5.48 ± 0.024 | 5.612 ± 0.031 |
3.629 ± 0.021 | 7.705 ± 0.036 |
2.279 ± 0.019 | 4.984 ± 0.025 |
3.688 ± 0.032 | 11.387 ± 0.046 |
Met |
Asn |
Gln |
Pro |
Arg |
Ser |
Thr |
Val |
Trp |
Tyr |
|---|---|---|---|---|---|---|---|---|---|
2.394 ± 0.018 | 3.212 ± 0.035 |
4.782 ± 0.029 | 4.553 ± 0.029 |
6.301 ± 0.032 | 6.195 ± 0.031 |
5.127 ± 0.027 | 7.089 ± 0.025 |
1.395 ± 0.015 | 2.544 ± 0.02 |
Most of the basic statistics you can see at this page can be downloaded from this CSV file
See this proteome in:

Proteome-pI is available under Creative Commons Attribution-NoDerivs license, for more details see here
| Reference: Kozlowski LP. Proteome-pI 2.0: Proteome Isoelectric Point Database Update. Nucleic Acids Res. 2021, doi: 10.1093/nar/gkab944 | Contact: Lukasz P. Kozlowski |