HIV-1 M_02CD.LBTB032
Taxonomy: Viruses; Riboviria; Pararnavirae; Artverviricota; Revtraviricetes; Ortervirales; Retroviridae; Orthoretrovirinae; Lentivirus; Human immunodeficiency virus 1; HIV-1 group M; HIV-1 group M unknown subgroup
Average proteome isoelectric point is 7.26
Get precalculated fractions of proteins
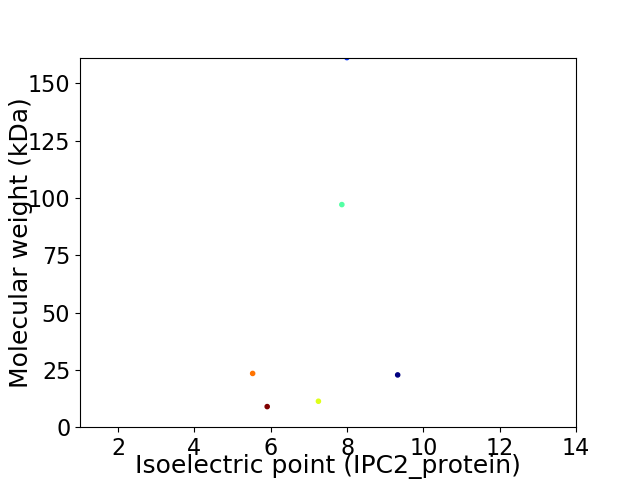
Virtual 2D-PAGE plot for 6 proteins (isoelectric point calculated using IPC2_protein)
Get csv file with sequences according to given criteria:
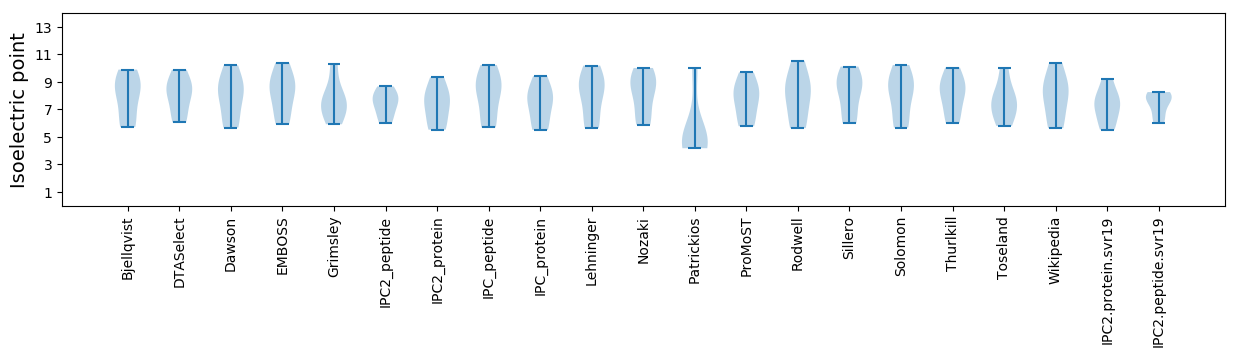
* You can choose from 21 different methods for calculating isoelectric point
Summary statistics related to proteome-wise predictions
Protein with the lowest isoelectric point:
>tr|C7TQ80|C7TQ80_9HIV1 Protein Nef OS=HIV-1 M_02CD.LBTB032 OX=576899 GN=nef PE=2 SV=1
MM1 pKa = 7.2GGKK4 pKa = 8.6WSKK7 pKa = 10.93SSIVGWPDD15 pKa = 2.52VRR17 pKa = 11.84EE18 pKa = 4.02RR19 pKa = 11.84MRR21 pKa = 11.84RR22 pKa = 11.84ASPAAEE28 pKa = 3.89GVGAASKK35 pKa = 11.07DD36 pKa = 3.38LDD38 pKa = 3.66KK39 pKa = 11.39FGAITSSNTPSTNADD54 pKa = 3.97CAWLEE59 pKa = 3.94AQEE62 pKa = 4.38EE63 pKa = 4.4EE64 pKa = 4.77GGVGFPVRR72 pKa = 11.84PQVPLRR78 pKa = 11.84PMTYY82 pKa = 9.94KK83 pKa = 10.84GAFDD87 pKa = 4.45LGFFLKK93 pKa = 10.62EE94 pKa = 3.8KK95 pKa = 10.62GGLDD99 pKa = 3.19GLIYY103 pKa = 10.29SKK105 pKa = 10.58KK106 pKa = 9.34RR107 pKa = 11.84QEE109 pKa = 5.1ILDD112 pKa = 3.35LWVYY116 pKa = 8.03HH117 pKa = 5.36TQGFFPDD124 pKa = 3.52WQNYY128 pKa = 6.23TPGPGIRR135 pKa = 11.84YY136 pKa = 7.88PLTFGWPYY144 pKa = 11.05KK145 pKa = 10.12LVPVDD150 pKa = 3.38PRR152 pKa = 11.84EE153 pKa = 3.95VEE155 pKa = 3.99KK156 pKa = 11.32ANEE159 pKa = 4.24GEE161 pKa = 4.39NNCLLHH167 pKa = 6.82PMSQHH172 pKa = 5.14GMEE175 pKa = 4.31DD176 pKa = 3.4EE177 pKa = 4.04EE178 pKa = 5.55RR179 pKa = 11.84EE180 pKa = 4.14VLKK183 pKa = 10.57WVFDD187 pKa = 3.57SSLARR192 pKa = 11.84EE193 pKa = 4.37HH194 pKa = 6.41VAHH197 pKa = 7.22KK198 pKa = 9.39LHH200 pKa = 6.69PEE202 pKa = 4.05YY203 pKa = 11.29YY204 pKa = 9.9KK205 pKa = 11.0DD206 pKa = 3.59CC207 pKa = 4.69
MM1 pKa = 7.2GGKK4 pKa = 8.6WSKK7 pKa = 10.93SSIVGWPDD15 pKa = 2.52VRR17 pKa = 11.84EE18 pKa = 4.02RR19 pKa = 11.84MRR21 pKa = 11.84RR22 pKa = 11.84ASPAAEE28 pKa = 3.89GVGAASKK35 pKa = 11.07DD36 pKa = 3.38LDD38 pKa = 3.66KK39 pKa = 11.39FGAITSSNTPSTNADD54 pKa = 3.97CAWLEE59 pKa = 3.94AQEE62 pKa = 4.38EE63 pKa = 4.4EE64 pKa = 4.77GGVGFPVRR72 pKa = 11.84PQVPLRR78 pKa = 11.84PMTYY82 pKa = 9.94KK83 pKa = 10.84GAFDD87 pKa = 4.45LGFFLKK93 pKa = 10.62EE94 pKa = 3.8KK95 pKa = 10.62GGLDD99 pKa = 3.19GLIYY103 pKa = 10.29SKK105 pKa = 10.58KK106 pKa = 9.34RR107 pKa = 11.84QEE109 pKa = 5.1ILDD112 pKa = 3.35LWVYY116 pKa = 8.03HH117 pKa = 5.36TQGFFPDD124 pKa = 3.52WQNYY128 pKa = 6.23TPGPGIRR135 pKa = 11.84YY136 pKa = 7.88PLTFGWPYY144 pKa = 11.05KK145 pKa = 10.12LVPVDD150 pKa = 3.38PRR152 pKa = 11.84EE153 pKa = 3.95VEE155 pKa = 3.99KK156 pKa = 11.32ANEE159 pKa = 4.24GEE161 pKa = 4.39NNCLLHH167 pKa = 6.82PMSQHH172 pKa = 5.14GMEE175 pKa = 4.31DD176 pKa = 3.4EE177 pKa = 4.04EE178 pKa = 5.55RR179 pKa = 11.84EE180 pKa = 4.14VLKK183 pKa = 10.57WVFDD187 pKa = 3.57SSLARR192 pKa = 11.84EE193 pKa = 4.37HH194 pKa = 6.41VAHH197 pKa = 7.22KK198 pKa = 9.39LHH200 pKa = 6.69PEE202 pKa = 4.05YY203 pKa = 11.29YY204 pKa = 9.9KK205 pKa = 11.0DD206 pKa = 3.59CC207 pKa = 4.69
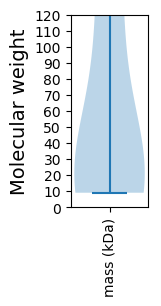
Molecular weight: 23.45 kDa
Isoelectric point according different methods:
Protein with the highest isoelectric point:
>tr|C7TQ77|C7TQ77_9HIV1 Protein Vpr OS=HIV-1 M_02CD.LBTB032 OX=576899 GN=vpr PE=3 SV=1
MM1 pKa = 7.3EE2 pKa = 5.21NRR4 pKa = 11.84WQVMIVWQVDD14 pKa = 3.04RR15 pKa = 11.84MRR17 pKa = 11.84IRR19 pKa = 11.84TWHH22 pKa = 6.66SIVKK26 pKa = 8.9HH27 pKa = 4.93HH28 pKa = 6.81MYY30 pKa = 10.24RR31 pKa = 11.84SKK33 pKa = 10.7KK34 pKa = 9.15AKK36 pKa = 8.17GWFYY40 pKa = 9.7RR41 pKa = 11.84HH42 pKa = 6.47HH43 pKa = 6.67YY44 pKa = 9.24EE45 pKa = 3.91SRR47 pKa = 11.84HH48 pKa = 5.47PKK50 pKa = 9.03VCSEE54 pKa = 3.54VHH56 pKa = 6.02IPIEE60 pKa = 3.93EE61 pKa = 3.87ARR63 pKa = 11.84LVIRR67 pKa = 11.84TYY69 pKa = 10.14WGLQPGEE76 pKa = 4.38KK77 pKa = 9.21AWHH80 pKa = 6.52LGHH83 pKa = 6.45GVSIEE88 pKa = 3.89WSQGKK93 pKa = 10.03YY94 pKa = 7.45STQVDD99 pKa = 3.99PDD101 pKa = 3.78LADD104 pKa = 3.51QLIHH108 pKa = 6.53LQYY111 pKa = 10.4FDD113 pKa = 4.94CFSEE117 pKa = 4.22STIRR121 pKa = 11.84KK122 pKa = 9.18AILGHH127 pKa = 6.64RR128 pKa = 11.84IIHH131 pKa = 5.5RR132 pKa = 11.84CEE134 pKa = 3.74YY135 pKa = 9.94QAGHH139 pKa = 6.08SKK141 pKa = 10.63VGSLQYY147 pKa = 10.76LALKK151 pKa = 9.2TLVEE155 pKa = 4.17PRR157 pKa = 11.84GTKK160 pKa = 9.95PPLPSVRR167 pKa = 11.84KK168 pKa = 8.46LTEE171 pKa = 4.14DD172 pKa = 3.16RR173 pKa = 11.84WNEE176 pKa = 3.69PQKK179 pKa = 9.76TRR181 pKa = 11.84GRR183 pKa = 11.84RR184 pKa = 11.84GNHH187 pKa = 5.44SMNGHH192 pKa = 6.49
MM1 pKa = 7.3EE2 pKa = 5.21NRR4 pKa = 11.84WQVMIVWQVDD14 pKa = 3.04RR15 pKa = 11.84MRR17 pKa = 11.84IRR19 pKa = 11.84TWHH22 pKa = 6.66SIVKK26 pKa = 8.9HH27 pKa = 4.93HH28 pKa = 6.81MYY30 pKa = 10.24RR31 pKa = 11.84SKK33 pKa = 10.7KK34 pKa = 9.15AKK36 pKa = 8.17GWFYY40 pKa = 9.7RR41 pKa = 11.84HH42 pKa = 6.47HH43 pKa = 6.67YY44 pKa = 9.24EE45 pKa = 3.91SRR47 pKa = 11.84HH48 pKa = 5.47PKK50 pKa = 9.03VCSEE54 pKa = 3.54VHH56 pKa = 6.02IPIEE60 pKa = 3.93EE61 pKa = 3.87ARR63 pKa = 11.84LVIRR67 pKa = 11.84TYY69 pKa = 10.14WGLQPGEE76 pKa = 4.38KK77 pKa = 9.21AWHH80 pKa = 6.52LGHH83 pKa = 6.45GVSIEE88 pKa = 3.89WSQGKK93 pKa = 10.03YY94 pKa = 7.45STQVDD99 pKa = 3.99PDD101 pKa = 3.78LADD104 pKa = 3.51QLIHH108 pKa = 6.53LQYY111 pKa = 10.4FDD113 pKa = 4.94CFSEE117 pKa = 4.22STIRR121 pKa = 11.84KK122 pKa = 9.18AILGHH127 pKa = 6.64RR128 pKa = 11.84IIHH131 pKa = 5.5RR132 pKa = 11.84CEE134 pKa = 3.74YY135 pKa = 9.94QAGHH139 pKa = 6.08SKK141 pKa = 10.63VGSLQYY147 pKa = 10.76LALKK151 pKa = 9.2TLVEE155 pKa = 4.17PRR157 pKa = 11.84GTKK160 pKa = 9.95PPLPSVRR167 pKa = 11.84KK168 pKa = 8.46LTEE171 pKa = 4.14DD172 pKa = 3.16RR173 pKa = 11.84WNEE176 pKa = 3.69PQKK179 pKa = 9.76TRR181 pKa = 11.84GRR183 pKa = 11.84RR184 pKa = 11.84GNHH187 pKa = 5.44SMNGHH192 pKa = 6.49
Molecular weight: 22.81 kDa
Isoelectric point according different methods:
Peptides (in silico digests for buttom-up proteomics)
Below you can find in silico digests of the whole proteome with Trypsin, Chymotrypsin, Trypsin+LysC, LysN, ArgC proteases suitable for different mass spec machines.| Try ESI |
 |
|---|
| ChTry ESI |
|
|---|
| ArgC ESI |
|
|---|
| LysN ESI |
|
|---|
| TryLysC ESI |
|
|---|
| Try MALDI |
|
|---|
| ChTry MALDI |
|
|---|
| ArgC MALDI |
|
|---|
| LysN MALDI |
|
|---|
| TryLysC MALDI |
|
|---|
| Try LTQ |
|
|---|
| ChTry LTQ |
|
|---|
| ArgC LTQ |
|
|---|
| LysN LTQ |
|
|---|
| TryLysC LTQ |
|
|---|
| Try MSlow |
|
|---|
| ChTry MSlow |
|
|---|
| ArgC MSlow |
|
|---|
| LysN MSlow |
|
|---|
| TryLysC MSlow |
|
|---|
| Try MShigh |
|
|---|
| ChTry MShigh |
|
|---|
| ArgC MShigh |
|
|---|
| LysN MShigh |
|
|---|
| TryLysC MShigh |
|
|---|
General Statistics
Number of major isoforms |
Number of additional isoforms |
Number of all proteins |
Number of amino acids |
Min. Seq. Length |
Max. Seq. Length |
Avg. Seq. Length |
Avg. Mol. Weight |
|---|---|---|---|---|---|---|---|
0 |
2868 |
81 |
1431 |
478.0 |
54.15 |
Amino acid frequency
Ala |
Cys |
Asp |
Glu |
Phe |
Gly |
His |
Ile |
Lys |
Leu |
|---|---|---|---|---|---|---|---|---|---|
6.137 ± 0.449 | 1.743 ± 0.358 |
4.393 ± 0.355 | 6.625 ± 0.589 |
2.755 ± 0.327 | 7.497 ± 0.349 |
2.406 ± 0.986 | 7.566 ± 0.674 |
6.974 ± 1.088 | 8.089 ± 0.631 |
Met |
Asn |
Gln |
Pro |
Arg |
Ser |
Thr |
Val |
Trp |
Tyr |
|---|---|---|---|---|---|---|---|---|---|
1.987 ± 0.098 | 5.021 ± 1.114 |
5.021 ± 0.573 | 5.579 ± 0.69 |
5.474 ± 0.934 | 4.916 ± 0.368 |
5.788 ± 0.592 | 6.311 ± 0.322 |
2.929 ± 0.246 | 2.72 ± 0.242 |
Most of the basic statistics you can see at this page can be downloaded from this CSV file
See this proteome in:

Proteome-pI is available under Creative Commons Attribution-NoDerivs license, for more details see here
| Reference: Kozlowski LP. Proteome-pI 2.0: Proteome Isoelectric Point Database Update. Nucleic Acids Res. 2021, doi: 10.1093/nar/gkab944 | Contact: Lukasz P. Kozlowski |