Candidatus Fokinia solitaria
Taxonomy: cellular organisms; Bacteria; Proteobacteria; Alphaproteobacteria; Rickettsiales; Candidatus Midichloriaceae; Candidatus Fokinia
Average proteome isoelectric point is 6.89
Get precalculated fractions of proteins
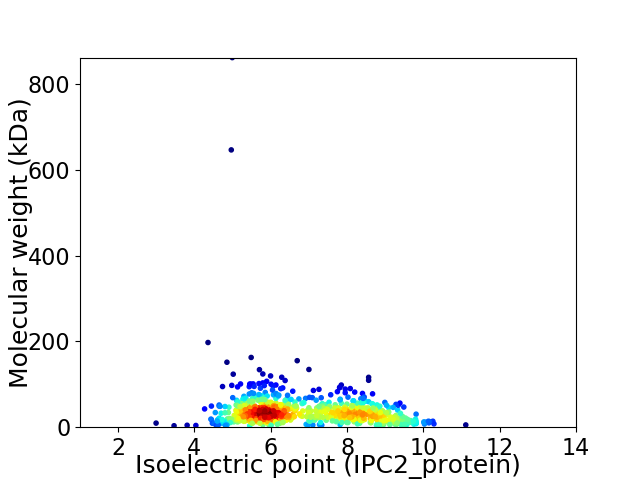
Virtual 2D-PAGE plot for 720 proteins (isoelectric point calculated using IPC2_protein)
Get csv file with sequences according to given criteria:
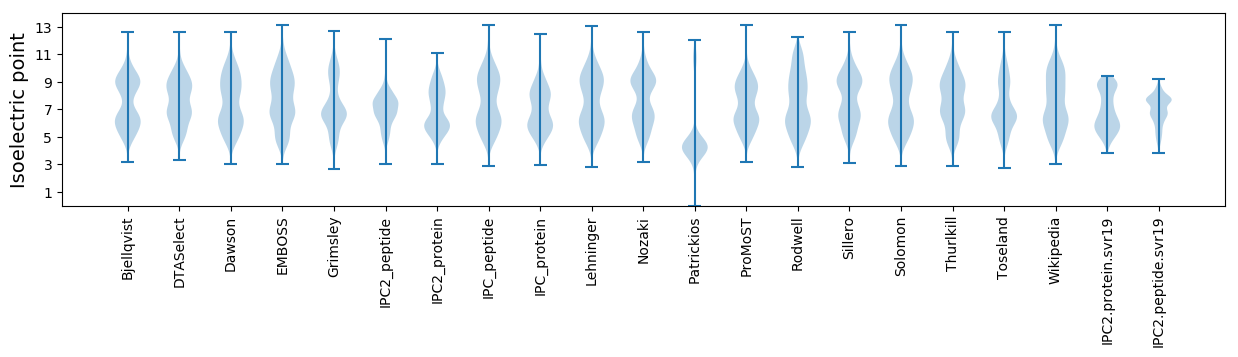
* You can choose from 21 different methods for calculating isoelectric point
Summary statistics related to proteome-wise predictions
Protein with the lowest isoelectric point:
>tr|A0A2U8BRW6|A0A2U8BRW6_9RICK Seryl-tRNA synthetase OS=Candidatus Fokinia solitaria OX=1802984 GN=Fsol_00280 PE=4 SV=1
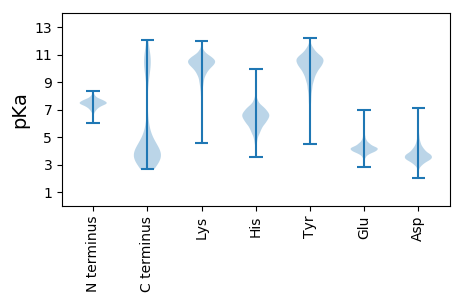
MM1 pKa = 7.18KK2 pKa = 10.15HH3 pKa = 5.32VPQYY7 pKa = 10.31YY8 pKa = 9.19QFILIYY14 pKa = 10.33LDD16 pKa = 4.05DD17 pKa = 4.13FTVVTILFDD26 pKa = 4.01FLLLLEE32 pKa = 4.61SDD34 pKa = 4.1EE35 pKa = 4.33MDD37 pKa = 3.04
MM1 pKa = 7.18KK2 pKa = 10.15HH3 pKa = 5.32VPQYY7 pKa = 10.31YY8 pKa = 9.19QFILIYY14 pKa = 10.33LDD16 pKa = 4.05DD17 pKa = 4.13FTVVTILFDD26 pKa = 4.01FLLLLEE32 pKa = 4.61SDD34 pKa = 4.1EE35 pKa = 4.33MDD37 pKa = 3.04
Molecular weight: 4.53 kDa
Isoelectric point according different methods:
Protein with the highest isoelectric point:
>tr|A0A2U8BS13|A0A2U8BS13_9RICK Uncharacterized protein OS=Candidatus Fokinia solitaria OX=1802984 GN=Fsol_00296 PE=4 SV=1
MM1 pKa = 6.85ATKK4 pKa = 9.5RR5 pKa = 11.84TYY7 pKa = 10.28QPSTIVRR14 pKa = 11.84KK15 pKa = 9.42RR16 pKa = 11.84RR17 pKa = 11.84HH18 pKa = 4.62GFRR21 pKa = 11.84ARR23 pKa = 11.84MATVGGRR30 pKa = 11.84AVIRR34 pKa = 11.84NRR36 pKa = 11.84RR37 pKa = 11.84AKK39 pKa = 9.91GRR41 pKa = 11.84HH42 pKa = 4.58VLSAA46 pKa = 3.81
MM1 pKa = 6.85ATKK4 pKa = 9.5RR5 pKa = 11.84TYY7 pKa = 10.28QPSTIVRR14 pKa = 11.84KK15 pKa = 9.42RR16 pKa = 11.84RR17 pKa = 11.84HH18 pKa = 4.62GFRR21 pKa = 11.84ARR23 pKa = 11.84MATVGGRR30 pKa = 11.84AVIRR34 pKa = 11.84NRR36 pKa = 11.84RR37 pKa = 11.84AKK39 pKa = 9.91GRR41 pKa = 11.84HH42 pKa = 4.58VLSAA46 pKa = 3.81
Molecular weight: 5.28 kDa
Isoelectric point according different methods:
Peptides (in silico digests for buttom-up proteomics)
Below you can find in silico digests of the whole proteome with Trypsin, Chymotrypsin, Trypsin+LysC, LysN, ArgC proteases suitable for different mass spec machines.| Try ESI |
 |
|---|
| ChTry ESI |
|
|---|
| ArgC ESI |
|
|---|
| LysN ESI |
|
|---|
| TryLysC ESI |
|
|---|
| Try MALDI |
|
|---|
| ChTry MALDI |
|
|---|
| ArgC MALDI |
|
|---|
| LysN MALDI |
|
|---|
| TryLysC MALDI |
|
|---|
| Try LTQ |
|
|---|
| ChTry LTQ |
|
|---|
| ArgC LTQ |
|
|---|
| LysN LTQ |
|
|---|
| TryLysC LTQ |
|
|---|
| Try MSlow |
|
|---|
| ChTry MSlow |
|
|---|
| ArgC MSlow |
|
|---|
| LysN MSlow |
|
|---|
| TryLysC MSlow |
|
|---|
| Try MShigh |
|
|---|
| ChTry MShigh |
|
|---|
| ArgC MShigh |
|
|---|
| LysN MShigh |
|
|---|
| TryLysC MShigh |
|
|---|
General Statistics
Number of major isoforms |
Number of additional isoforms |
Number of all proteins |
Number of amino acids |
Min. Seq. Length |
Max. Seq. Length |
Avg. Seq. Length |
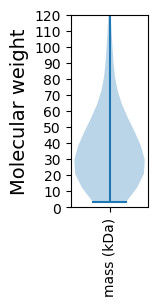
Avg. Mol. Weight |
|---|---|---|---|---|---|---|---|
0 |
247709 |
29 |
7555 |
344.0 |
38.8 |
Amino acid frequency
Ala |
Cys |
Asp |
Glu |
Phe |
Gly |
His |
Ile |
Lys |
Leu |
|---|---|---|---|---|---|---|---|---|---|
6.616 ± 0.073 | 1.549 ± 0.046 |
5.103 ± 0.085 | 6.603 ± 0.159 |
4.498 ± 0.083 | 5.324 ± 0.095 |
2.248 ± 0.049 | 9.016 ± 0.102 |
7.565 ± 0.097 | 9.256 ± 0.085 |
Met |
Asn |
Gln |
Pro |
Arg |
Ser |
Thr |
Val |
Trp |
Tyr |
|---|---|---|---|---|---|---|---|---|---|
2.733 ± 0.053 | 5.173 ± 0.063 |
2.643 ± 0.056 | 3.434 ± 0.116 |
4.109 ± 0.065 | 7.964 ± 0.095 |
5.181 ± 0.083 | 6.552 ± 0.089 |
0.647 ± 0.025 | 3.787 ± 0.065 |
Most of the basic statistics you can see at this page can be downloaded from this CSV file
See this proteome in:

Proteome-pI is available under Creative Commons Attribution-NoDerivs license, for more details see here
| Reference: Kozlowski LP. Proteome-pI 2.0: Proteome Isoelectric Point Database Update. Nucleic Acids Res. 2021, doi: 10.1093/nar/gkab944 | Contact: Lukasz P. Kozlowski |