bacterium HR29
Taxonomy: cellular organisms; Bacteria; unclassified Bacteria
Average proteome isoelectric point is 6.44
Get precalculated fractions of proteins
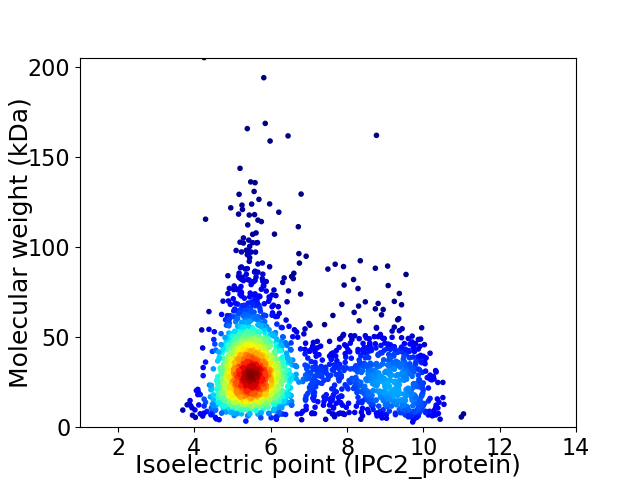
Virtual 2D-PAGE plot for 2317 proteins (isoelectric point calculated using IPC2_protein)
Get csv file with sequences according to given criteria:
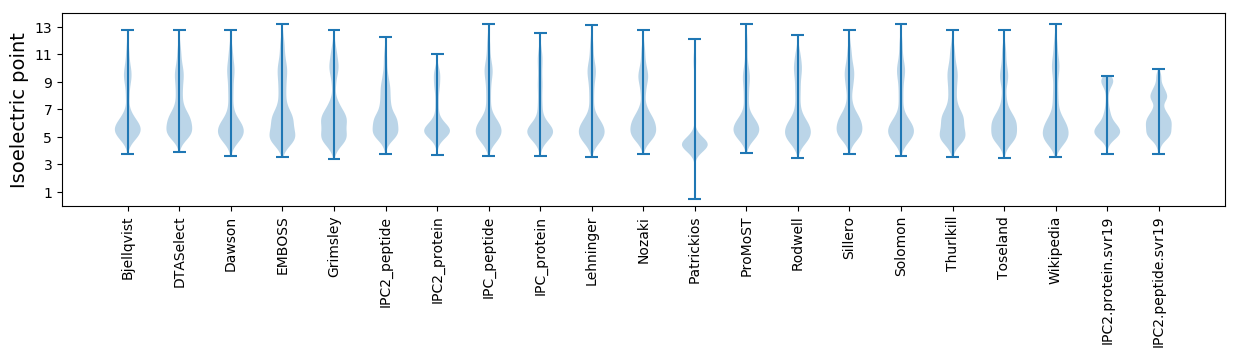
* You can choose from 21 different methods for calculating isoelectric point
Summary statistics related to proteome-wise predictions
Protein with the lowest isoelectric point:
>tr|A0A2H5ZE43|A0A2H5ZE43_9BACT Uncharacterized protein OS=bacterium HR29 OX=2035424 GN=HRbin29_01628 PE=4 SV=1
MM1 pKa = 7.61LLCLLSGFACSHH13 pKa = 6.69SDD15 pKa = 3.64PNSDD19 pKa = 3.07TDD21 pKa = 4.05TNAHH25 pKa = 6.48ANADD29 pKa = 4.14SQPHH33 pKa = 6.95PDD35 pKa = 3.84SDD37 pKa = 3.95SHH39 pKa = 6.55TDD41 pKa = 4.15AADD44 pKa = 2.92GWAASGRR51 pKa = 11.84SAGPYY56 pKa = 10.25AEE58 pKa = 4.96LSEE61 pKa = 4.77DD62 pKa = 3.54AAPP65 pKa = 4.21
MM1 pKa = 7.61LLCLLSGFACSHH13 pKa = 6.69SDD15 pKa = 3.64PNSDD19 pKa = 3.07TDD21 pKa = 4.05TNAHH25 pKa = 6.48ANADD29 pKa = 4.14SQPHH33 pKa = 6.95PDD35 pKa = 3.84SDD37 pKa = 3.95SHH39 pKa = 6.55TDD41 pKa = 4.15AADD44 pKa = 2.92GWAASGRR51 pKa = 11.84SAGPYY56 pKa = 10.25AEE58 pKa = 4.96LSEE61 pKa = 4.77DD62 pKa = 3.54AAPP65 pKa = 4.21
Molecular weight: 6.63 kDa
Isoelectric point according different methods:
Protein with the highest isoelectric point:
>tr|A0A2H5ZF64|A0A2H5ZF64_9BACT Sensor kinase CckA OS=bacterium HR29 OX=2035424 GN=cckA_4 PE=4 SV=1
MM1 pKa = 8.0PKK3 pKa = 9.08RR4 pKa = 11.84TFQPHH9 pKa = 3.81NRR11 pKa = 11.84RR12 pKa = 11.84RR13 pKa = 11.84FRR15 pKa = 11.84VHH17 pKa = 6.5GFRR20 pKa = 11.84ARR22 pKa = 11.84MKK24 pKa = 8.69TRR26 pKa = 11.84AGRR29 pKa = 11.84LVLKK33 pKa = 10.52ARR35 pKa = 11.84RR36 pKa = 11.84LKK38 pKa = 10.07GRR40 pKa = 11.84KK41 pKa = 9.08RR42 pKa = 11.84LTVEE46 pKa = 3.7
MM1 pKa = 8.0PKK3 pKa = 9.08RR4 pKa = 11.84TFQPHH9 pKa = 3.81NRR11 pKa = 11.84RR12 pKa = 11.84RR13 pKa = 11.84FRR15 pKa = 11.84VHH17 pKa = 6.5GFRR20 pKa = 11.84ARR22 pKa = 11.84MKK24 pKa = 8.69TRR26 pKa = 11.84AGRR29 pKa = 11.84LVLKK33 pKa = 10.52ARR35 pKa = 11.84RR36 pKa = 11.84LKK38 pKa = 10.07GRR40 pKa = 11.84KK41 pKa = 9.08RR42 pKa = 11.84LTVEE46 pKa = 3.7
Molecular weight: 5.67 kDa
Isoelectric point according different methods:
Peptides (in silico digests for buttom-up proteomics)
Below you can find in silico digests of the whole proteome with Trypsin, Chymotrypsin, Trypsin+LysC, LysN, ArgC proteases suitable for different mass spec machines.| Try ESI |
 |
|---|
| ChTry ESI |
|
|---|
| ArgC ESI |
|
|---|
| LysN ESI |
|
|---|
| TryLysC ESI |
|
|---|
| Try MALDI |
|
|---|
| ChTry MALDI |
|
|---|
| ArgC MALDI |
|
|---|
| LysN MALDI |
|
|---|
| TryLysC MALDI |
|
|---|
| Try LTQ |
|
|---|
| ChTry LTQ |
|
|---|
| ArgC LTQ |
|
|---|
| LysN LTQ |
|
|---|
| TryLysC LTQ |
|
|---|
| Try MSlow |
|
|---|
| ChTry MSlow |
|
|---|
| ArgC MSlow |
|
|---|
| LysN MSlow |
|
|---|
| TryLysC MSlow |
|
|---|
| Try MShigh |
|
|---|
| ChTry MShigh |
|
|---|
| ArgC MShigh |
|
|---|
| LysN MShigh |
|
|---|
| TryLysC MShigh |
|
|---|
General Statistics
Number of major isoforms |
Number of additional isoforms |
Number of all proteins |
Number of amino acids |
Min. Seq. Length |
Max. Seq. Length |
Avg. Seq. Length |
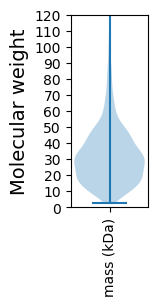
Avg. Mol. Weight |
|---|---|---|---|---|---|---|---|
0 |
719333 |
29 |
1969 |
310.5 |
33.77 |
Amino acid frequency
Ala |
Cys |
Asp |
Glu |
Phe |
Gly |
His |
Ile |
Lys |
Leu |
|---|---|---|---|---|---|---|---|---|---|
13.449 ± 0.083 | 0.861 ± 0.018 |
4.872 ± 0.029 | 7.202 ± 0.055 |
3.453 ± 0.031 | 8.736 ± 0.05 |
1.871 ± 0.021 | 4.196 ± 0.035 |
1.898 ± 0.032 | 10.456 ± 0.05 |
Met |
Asn |
Gln |
Pro |
Arg |
Ser |
Thr |
Val |
Trp |
Tyr |
|---|---|---|---|---|---|---|---|---|---|
1.816 ± 0.019 | 1.859 ± 0.026 |
6.214 ± 0.044 | 2.645 ± 0.034 |
9.159 ± 0.055 | 4.384 ± 0.036 |
4.741 ± 0.037 | 8.397 ± 0.046 |
1.544 ± 0.022 | 2.247 ± 0.024 |
Most of the basic statistics you can see at this page can be downloaded from this CSV file
See this proteome in:

Proteome-pI is available under Creative Commons Attribution-NoDerivs license, for more details see here
| Reference: Kozlowski LP. Proteome-pI 2.0: Proteome Isoelectric Point Database Update. Nucleic Acids Res. 2021, doi: 10.1093/nar/gkab944 | Contact: Lukasz P. Kozlowski |