Prevotella bryantii B14
Taxonomy: cellular organisms; Bacteria; FCB group; Bacteroidetes/Chlorobi group; Bacteroidetes; Bacteroidia; Bacteroidales; Prevotellaceae; Prevotella; Prevotella bryantii
Average proteome isoelectric point is 6.47
Get precalculated fractions of proteins
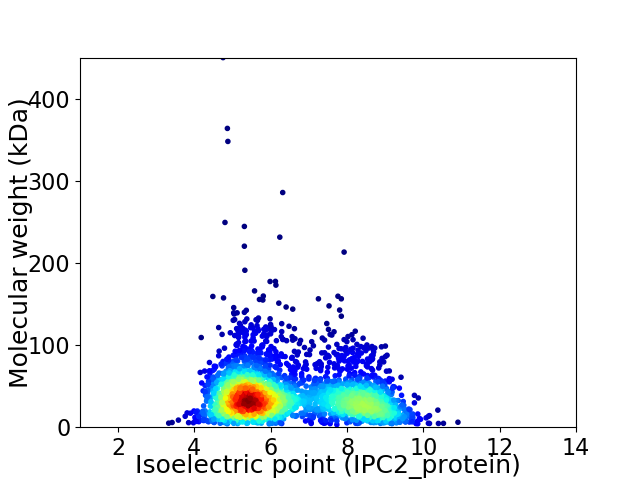
Virtual 2D-PAGE plot for 2748 proteins (isoelectric point calculated using IPC2_protein)
Get csv file with sequences according to given criteria:
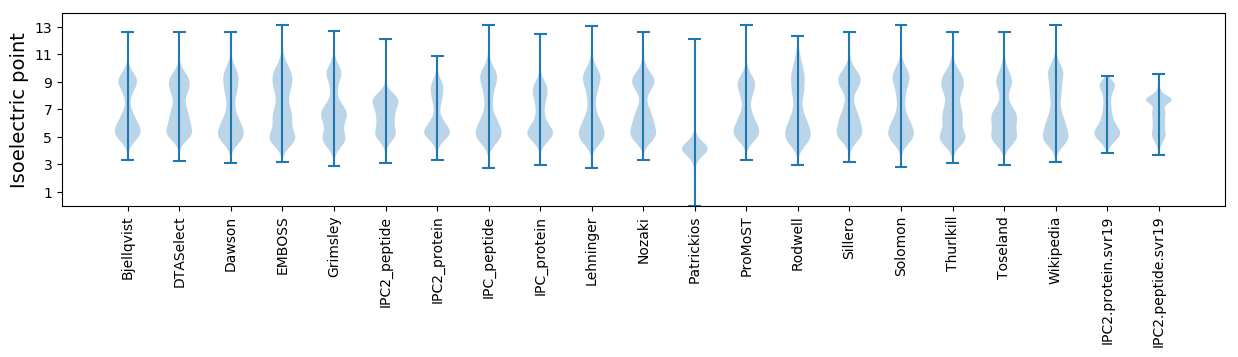
* You can choose from 21 different methods for calculating isoelectric point
Summary statistics related to proteome-wise predictions
Protein with the lowest isoelectric point:
>tr|D8DV14|D8DV14_PREBR Putative lipoprotein OS=Prevotella bryantii B14 OX=752555 GN=PBR_0386 PE=4 SV=1
HHH2 pKa = 7.04LFWPIPNSAITANNQGQLRR21 pKa = 11.84QNYYY25 pKa = 9.45YYY27 pKa = 10.57DD28 pKa = 3.77YYY30 pKa = 11.62DDD32 pKa = 6.04IPMWTNWEEE41 pKa = 3.99DD42 pKa = 3.68VADDD46 pKa = 4.08EE47 pKa = 4.42
HHH2 pKa = 7.04LFWPIPNSAITANNQGQLRR21 pKa = 11.84QNYYY25 pKa = 9.45YYY27 pKa = 10.57DD28 pKa = 3.77YYY30 pKa = 11.62DDD32 pKa = 6.04IPMWTNWEEE41 pKa = 3.99DD42 pKa = 3.68VADDD46 pKa = 4.08EE47 pKa = 4.42
Molecular weight: 5.41 kDa
Isoelectric point according different methods:
Protein with the highest isoelectric point:
>tr|D8DU91|D8DU91_PREBR Transcriptional regulator MraZ OS=Prevotella bryantii B14 OX=752555 GN=mraZ PE=3 SV=1
MM1 pKa = 7.38KK2 pKa = 9.6RR3 pKa = 11.84TFQPHH8 pKa = 3.81NRR10 pKa = 11.84RR11 pKa = 11.84RR12 pKa = 11.84VNKK15 pKa = 8.88HH16 pKa = 4.1GFRR19 pKa = 11.84ARR21 pKa = 11.84MATKK25 pKa = 9.97NGRR28 pKa = 11.84RR29 pKa = 11.84VLASRR34 pKa = 11.84RR35 pKa = 11.84AHH37 pKa = 5.44GRR39 pKa = 11.84KK40 pKa = 9.33KK41 pKa = 9.62LTVSSEE47 pKa = 4.03HH48 pKa = 6.64HH49 pKa = 6.27GKK51 pKa = 10.17
MM1 pKa = 7.38KK2 pKa = 9.6RR3 pKa = 11.84TFQPHH8 pKa = 3.81NRR10 pKa = 11.84RR11 pKa = 11.84RR12 pKa = 11.84VNKK15 pKa = 8.88HH16 pKa = 4.1GFRR19 pKa = 11.84ARR21 pKa = 11.84MATKK25 pKa = 9.97NGRR28 pKa = 11.84RR29 pKa = 11.84VLASRR34 pKa = 11.84RR35 pKa = 11.84AHH37 pKa = 5.44GRR39 pKa = 11.84KK40 pKa = 9.33KK41 pKa = 9.62LTVSSEE47 pKa = 4.03HH48 pKa = 6.64HH49 pKa = 6.27GKK51 pKa = 10.17
Molecular weight: 6.05 kDa
Isoelectric point according different methods:
Peptides (in silico digests for buttom-up proteomics)
Below you can find in silico digests of the whole proteome with Trypsin, Chymotrypsin, Trypsin+LysC, LysN, ArgC proteases suitable for different mass spec machines.| Try ESI |
 |
|---|
| ChTry ESI |
|
|---|
| ArgC ESI |
|
|---|
| LysN ESI |
|
|---|
| TryLysC ESI |
|
|---|
| Try MALDI |
|
|---|
| ChTry MALDI |
|
|---|
| ArgC MALDI |
|
|---|
| LysN MALDI |
|
|---|
| TryLysC MALDI |
|
|---|
| Try LTQ |
|
|---|
| ChTry LTQ |
|
|---|
| ArgC LTQ |
|
|---|
| LysN LTQ |
|
|---|
| TryLysC LTQ |
|
|---|
| Try MSlow |
|
|---|
| ChTry MSlow |
|
|---|
| ArgC MSlow |
|
|---|
| LysN MSlow |
|
|---|
| TryLysC MSlow |
|
|---|
| Try MShigh |
|
|---|
| ChTry MShigh |
|
|---|
| ArgC MShigh |
|
|---|
| LysN MShigh |
|
|---|
| TryLysC MShigh |
|
|---|
General Statistics
Number of major isoforms |
Number of additional isoforms |
Number of all proteins |
Number of amino acids |
Min. Seq. Length |
Max. Seq. Length |
Avg. Seq. Length |
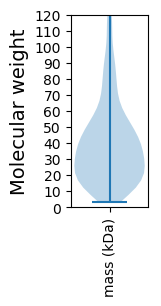
Avg. Mol. Weight |
|---|---|---|---|---|---|---|---|
0 |
1019909 |
30 |
4092 |
371.1 |
41.91 |
Amino acid frequency
Ala |
Cys |
Asp |
Glu |
Phe |
Gly |
His |
Ile |
Lys |
Leu |
|---|---|---|---|---|---|---|---|---|---|
6.902 ± 0.037 | 1.228 ± 0.017 |
5.891 ± 0.029 | 6.007 ± 0.044 |
4.363 ± 0.03 | 6.766 ± 0.048 |
2.182 ± 0.022 | 7.279 ± 0.051 |
6.911 ± 0.041 | 8.589 ± 0.05 |
Met |
Asn |
Gln |
Pro |
Arg |
Ser |
Thr |
Val |
Trp |
Tyr |
|---|---|---|---|---|---|---|---|---|---|
2.749 ± 0.022 | 5.616 ± 0.052 |
3.453 ± 0.024 | 3.734 ± 0.025 |
4.164 ± 0.03 | 6.279 ± 0.044 |
5.761 ± 0.048 | 6.2 ± 0.035 |
1.313 ± 0.022 | 4.611 ± 0.035 |
Most of the basic statistics you can see at this page can be downloaded from this CSV file
See this proteome in:

Proteome-pI is available under Creative Commons Attribution-NoDerivs license, for more details see here
| Reference: Kozlowski LP. Proteome-pI 2.0: Proteome Isoelectric Point Database Update. Nucleic Acids Res. 2021, doi: 10.1093/nar/gkab944 | Contact: Lukasz P. Kozlowski |