Synechococcus phage S-SM2
Taxonomy: Viruses; Duplodnaviria; Heunggongvirae; Uroviricota; Caudoviricetes; Caudovirales; Myoviridae; Bellamyvirus; unclassified Bellamyvirus
Average proteome isoelectric point is 5.85
Get precalculated fractions of proteins
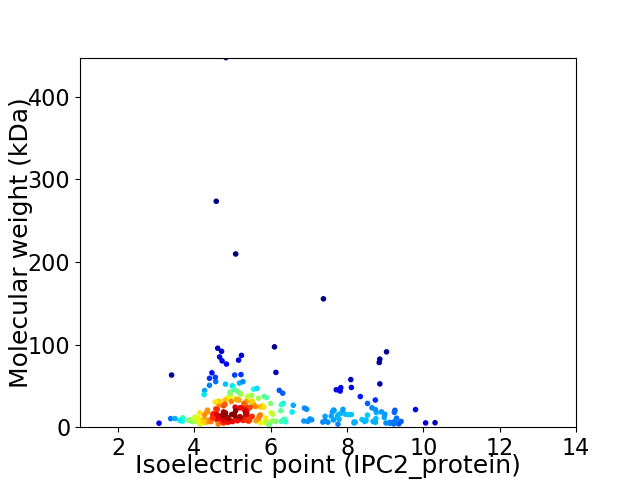
Virtual 2D-PAGE plot for 267 proteins (isoelectric point calculated using IPC2_protein)
Get csv file with sequences according to given criteria:
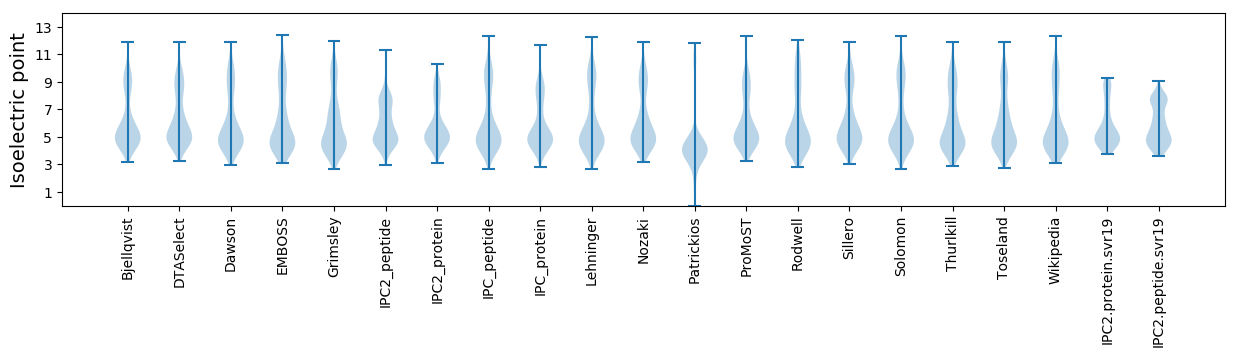
* You can choose from 21 different methods for calculating isoelectric point
Summary statistics related to proteome-wise predictions
Protein with the lowest isoelectric point:
>tr|E3SJE7|E3SJE7_9CAUD Uncharacterized protein OS=Synechococcus phage S-SM2 OX=444860 GN=SSM2_262 PE=4 SV=1
MM1 pKa = 7.39LAVTLTIGTLVSITMFFVGGMVGWLAKK28 pKa = 9.29EE29 pKa = 4.19HH30 pKa = 6.52VYY32 pKa = 8.46QTQPVYY38 pKa = 9.48THH40 pKa = 7.25PEE42 pKa = 3.81MFDD45 pKa = 3.28EE46 pKa = 4.79NGNVLPDD53 pKa = 4.16EE54 pKa = 4.29ILAVRR59 pKa = 11.84FEE61 pKa = 4.43NDD63 pKa = 3.09YY64 pKa = 11.26EE65 pKa = 4.27PNEE68 pKa = 4.81DD69 pKa = 4.01YY70 pKa = 11.33DD71 pKa = 4.61EE72 pKa = 4.55EE73 pKa = 4.47DD74 pKa = 3.08
MM1 pKa = 7.39LAVTLTIGTLVSITMFFVGGMVGWLAKK28 pKa = 9.29EE29 pKa = 4.19HH30 pKa = 6.52VYY32 pKa = 8.46QTQPVYY38 pKa = 9.48THH40 pKa = 7.25PEE42 pKa = 3.81MFDD45 pKa = 3.28EE46 pKa = 4.79NGNVLPDD53 pKa = 4.16EE54 pKa = 4.29ILAVRR59 pKa = 11.84FEE61 pKa = 4.43NDD63 pKa = 3.09YY64 pKa = 11.26EE65 pKa = 4.27PNEE68 pKa = 4.81DD69 pKa = 4.01YY70 pKa = 11.33DD71 pKa = 4.61EE72 pKa = 4.55EE73 pKa = 4.47DD74 pKa = 3.08
Molecular weight: 8.49 kDa
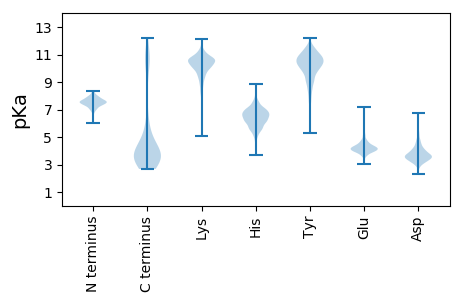
Isoelectric point according different methods:
Protein with the highest isoelectric point:
>tr|E3SJD8|E3SJD8_9CAUD Photosystem II D1 protein OS=Synechococcus phage S-SM2 OX=444860 GN=psbA PE=3 SV=1
MM1 pKa = 7.3MLLPYY6 pKa = 9.56MSEE9 pKa = 3.94PATGSRR15 pKa = 11.84MPSMSTGGAAMKK27 pKa = 9.56ATMKK31 pKa = 10.64QIVAANRR38 pKa = 11.84VGIIRR43 pKa = 11.84TPNQPTT49 pKa = 3.15
MM1 pKa = 7.3MLLPYY6 pKa = 9.56MSEE9 pKa = 3.94PATGSRR15 pKa = 11.84MPSMSTGGAAMKK27 pKa = 9.56ATMKK31 pKa = 10.64QIVAANRR38 pKa = 11.84VGIIRR43 pKa = 11.84TPNQPTT49 pKa = 3.15
Molecular weight: 5.2 kDa
Isoelectric point according different methods:
Peptides (in silico digests for buttom-up proteomics)
Below you can find in silico digests of the whole proteome with Trypsin, Chymotrypsin, Trypsin+LysC, LysN, ArgC proteases suitable for different mass spec machines.| Try ESI |
 |
|---|
| ChTry ESI |
|
|---|
| ArgC ESI |
|
|---|
| LysN ESI |
|
|---|
| TryLysC ESI |
|
|---|
| Try MALDI |
|
|---|
| ChTry MALDI |
|
|---|
| ArgC MALDI |
|
|---|
| LysN MALDI |
|
|---|
| TryLysC MALDI |
|
|---|
| Try LTQ |
|
|---|
| ChTry LTQ |
|
|---|
| ArgC LTQ |
|
|---|
| LysN LTQ |
|
|---|
| TryLysC LTQ |
|
|---|
| Try MSlow |
|
|---|
| ChTry MSlow |
|
|---|
| ArgC MSlow |
|
|---|
| LysN MSlow |
|
|---|
| TryLysC MSlow |
|
|---|
| Try MShigh |
|
|---|
| ChTry MShigh |
|
|---|
| ArgC MShigh |
|
|---|
| LysN MShigh |
|
|---|
| TryLysC MShigh |
|
|---|
General Statistics
Number of major isoforms |
Number of additional isoforms |
Number of all proteins |
Number of amino acids |
Min. Seq. Length |
Max. Seq. Length |
Avg. Seq. Length |
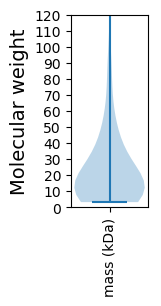
Avg. Mol. Weight |
|---|---|---|---|---|---|---|---|
0 |
61413 |
30 |
4156 |
230.0 |
25.71 |
Amino acid frequency
Ala |
Cys |
Asp |
Glu |
Phe |
Gly |
His |
Ile |
Lys |
Leu |
|---|---|---|---|---|---|---|---|---|---|
6.248 ± 0.203 | 0.977 ± 0.086 |
6.652 ± 0.119 | 6.694 ± 0.262 |
4.372 ± 0.106 | 7.712 ± 0.321 |
1.718 ± 0.1 | 6.363 ± 0.134 |
6.541 ± 0.341 | 7.194 ± 0.138 |
Met |
Asn |
Gln |
Pro |
Arg |
Ser |
Thr |
Val |
Trp |
Tyr |
|---|---|---|---|---|---|---|---|---|---|
2.317 ± 0.152 | 5.561 ± 0.157 |
3.989 ± 0.141 | 3.476 ± 0.12 |
4.276 ± 0.132 | 6.865 ± 0.223 |
6.911 ± 0.388 | 6.878 ± 0.195 |
1.174 ± 0.102 | 4.082 ± 0.129 |
Most of the basic statistics you can see at this page can be downloaded from this CSV file
See this proteome in:

Proteome-pI is available under Creative Commons Attribution-NoDerivs license, for more details see here
| Reference: Kozlowski LP. Proteome-pI 2.0: Proteome Isoelectric Point Database Update. Nucleic Acids Res. 2021, doi: 10.1093/nar/gkab944 | Contact: Lukasz P. Kozlowski |