Sphingobium baderi LL03
Taxonomy: cellular organisms; Bacteria; Proteobacteria; Alphaproteobacteria; Sphingomonadales; Sphingomonadaceae; Sphingobium; Sphingobium baderi
Average proteome isoelectric point is 6.64
Get precalculated fractions of proteins
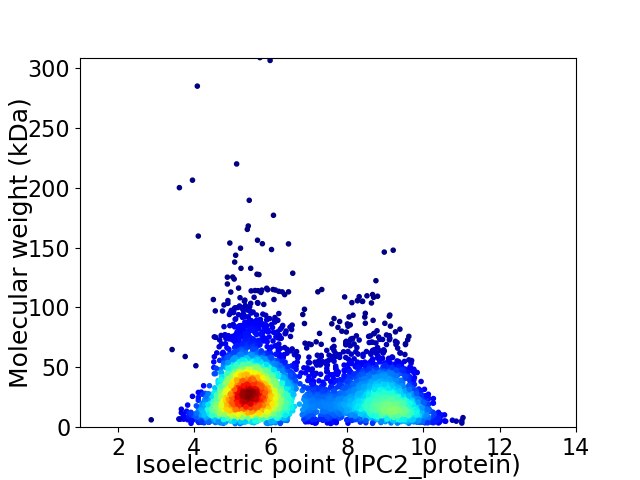
Virtual 2D-PAGE plot for 4697 proteins (isoelectric point calculated using IPC2_protein)
Get csv file with sequences according to given criteria:
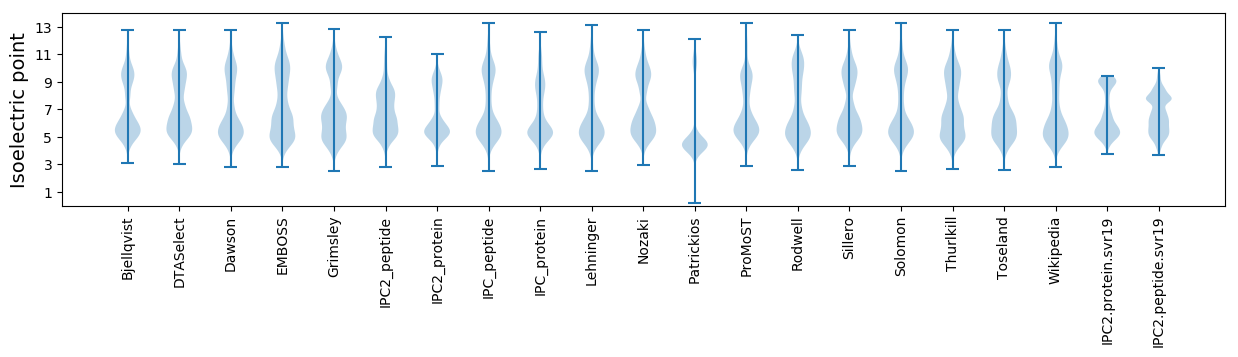
* You can choose from 21 different methods for calculating isoelectric point
Summary statistics related to proteome-wise predictions
Protein with the lowest isoelectric point:
>tr|T0HDB5|T0HDB5_9SPHN Formate dehydrogenase OS=Sphingobium baderi LL03 OX=1114964 GN=L485_21070 PE=3 SV=1
MM1 pKa = 7.12RR2 pKa = 11.84TTYY5 pKa = 10.7EE6 pKa = 4.03SATVRR11 pKa = 11.84LYY13 pKa = 10.82HH14 pKa = 7.17LSDD17 pKa = 3.54AQEE20 pKa = 4.34GGAATTLFYY29 pKa = 11.34GPLNEE34 pKa = 4.82ALLIAEE40 pKa = 4.76GQPADD45 pKa = 3.8VQDD48 pKa = 4.48SLFLATDD55 pKa = 3.65NDD57 pKa = 3.68VVAYY61 pKa = 10.42LDD63 pKa = 4.8LIGGG67 pKa = 4.02
MM1 pKa = 7.12RR2 pKa = 11.84TTYY5 pKa = 10.7EE6 pKa = 4.03SATVRR11 pKa = 11.84LYY13 pKa = 10.82HH14 pKa = 7.17LSDD17 pKa = 3.54AQEE20 pKa = 4.34GGAATTLFYY29 pKa = 11.34GPLNEE34 pKa = 4.82ALLIAEE40 pKa = 4.76GQPADD45 pKa = 3.8VQDD48 pKa = 4.48SLFLATDD55 pKa = 3.65NDD57 pKa = 3.68VVAYY61 pKa = 10.42LDD63 pKa = 4.8LIGGG67 pKa = 4.02
Molecular weight: 7.16 kDa
Isoelectric point according different methods:
Protein with the highest isoelectric point:
>tr|T0GCP9|T0GCP9_9SPHN Amidohydro-rel domain-containing protein OS=Sphingobium baderi LL03 OX=1114964 GN=L485_17365 PE=4 SV=1
MM1 pKa = 7.33TLGSAMTGGIVRR13 pKa = 11.84VGRR16 pKa = 11.84MIAAARR22 pKa = 11.84RR23 pKa = 11.84HH24 pKa = 5.89RR25 pKa = 11.84LRR27 pKa = 11.84LMNRR31 pKa = 3.32
MM1 pKa = 7.33TLGSAMTGGIVRR13 pKa = 11.84VGRR16 pKa = 11.84MIAAARR22 pKa = 11.84RR23 pKa = 11.84HH24 pKa = 5.89RR25 pKa = 11.84LRR27 pKa = 11.84LMNRR31 pKa = 3.32
Molecular weight: 3.45 kDa
Isoelectric point according different methods:
Peptides (in silico digests for buttom-up proteomics)
Below you can find in silico digests of the whole proteome with Trypsin, Chymotrypsin, Trypsin+LysC, LysN, ArgC proteases suitable for different mass spec machines.| Try ESI |
 |
|---|
| ChTry ESI |
|
|---|
| ArgC ESI |
|
|---|
| LysN ESI |
|
|---|
| TryLysC ESI |
|
|---|
| Try MALDI |
|
|---|
| ChTry MALDI |
|
|---|
| ArgC MALDI |
|
|---|
| LysN MALDI |
|
|---|
| TryLysC MALDI |
|
|---|
| Try LTQ |
|
|---|
| ChTry LTQ |
|
|---|
| ArgC LTQ |
|
|---|
| LysN LTQ |
|
|---|
| TryLysC LTQ |
|
|---|
| Try MSlow |
|
|---|
| ChTry MSlow |
|
|---|
| ArgC MSlow |
|
|---|
| LysN MSlow |
|
|---|
| TryLysC MSlow |
|
|---|
| Try MShigh |
|
|---|
| ChTry MShigh |
|
|---|
| ArgC MShigh |
|
|---|
| LysN MShigh |
|
|---|
| TryLysC MShigh |
|
|---|
General Statistics
Number of major isoforms |
Number of additional isoforms |
Number of all proteins |
Number of amino acids |
Min. Seq. Length |
Max. Seq. Length |
Avg. Seq. Length |
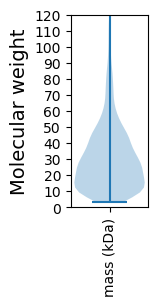
Avg. Mol. Weight |
|---|---|---|---|---|---|---|---|
0 |
1382595 |
29 |
2899 |
294.4 |
31.91 |
Amino acid frequency
Ala |
Cys |
Asp |
Glu |
Phe |
Gly |
His |
Ile |
Lys |
Leu |
|---|---|---|---|---|---|---|---|---|---|
13.052 ± 0.052 | 0.829 ± 0.011 |
5.977 ± 0.026 | 5.502 ± 0.032 |
3.481 ± 0.022 | 8.817 ± 0.046 |
2.096 ± 0.021 | 5.222 ± 0.025 |
3.055 ± 0.027 | 9.987 ± 0.039 |
Met |
Asn |
Gln |
Pro |
Arg |
Ser |
Thr |
Val |
Trp |
Tyr |
|---|---|---|---|---|---|---|---|---|---|
2.636 ± 0.019 | 2.498 ± 0.023 |
5.174 ± 0.025 | 3.223 ± 0.018 |
7.607 ± 0.043 | 5.318 ± 0.027 |
5.009 ± 0.031 | 6.942 ± 0.029 |
1.397 ± 0.014 | 2.179 ± 0.017 |
Most of the basic statistics you can see at this page can be downloaded from this CSV file
See this proteome in:

Proteome-pI is available under Creative Commons Attribution-NoDerivs license, for more details see here
| Reference: Kozlowski LP. Proteome-pI 2.0: Proteome Isoelectric Point Database Update. Nucleic Acids Res. 2021, doi: 10.1093/nar/gkab944 | Contact: Lukasz P. Kozlowski |