Mesorhizobium sp. LSHC420B00
Taxonomy: cellular organisms; Bacteria; Proteobacteria; Alphaproteobacteria; Hyphomicrobiales; Phyllobacteriaceae; Mesorhizobium; unclassified Mesorhizobium
Average proteome isoelectric point is 6.71
Get precalculated fractions of proteins
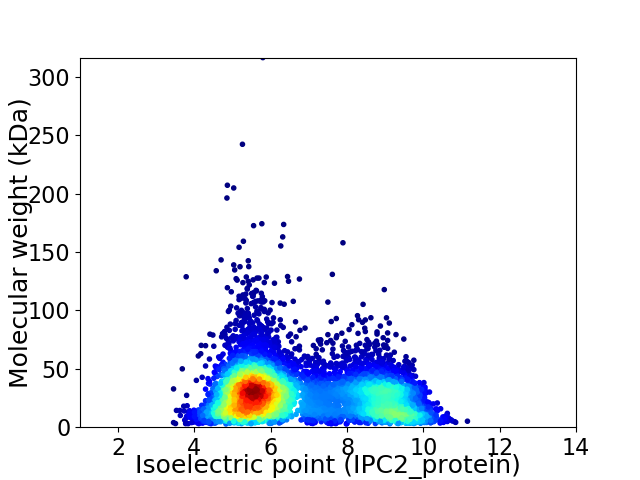
Virtual 2D-PAGE plot for 7026 proteins (isoelectric point calculated using IPC2_protein)
Get csv file with sequences according to given criteria:
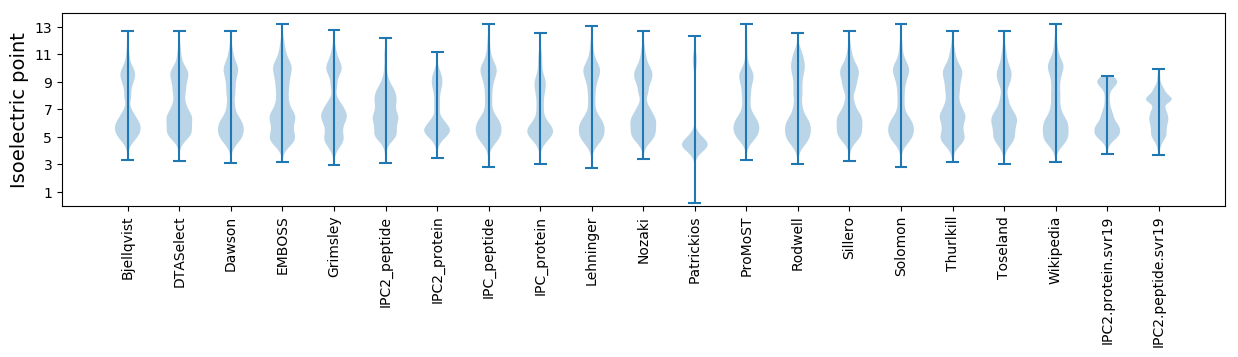
* You can choose from 21 different methods for calculating isoelectric point
Summary statistics related to proteome-wise predictions
Protein with the lowest isoelectric point:
>tr|V7FH68|V7FH68_9RHIZ Bifunctional adenosylcobalamin biosynthesis protein OS=Mesorhizobium sp. LSHC420B00 OX=1287292 GN=X759_23045 PE=3 SV=1
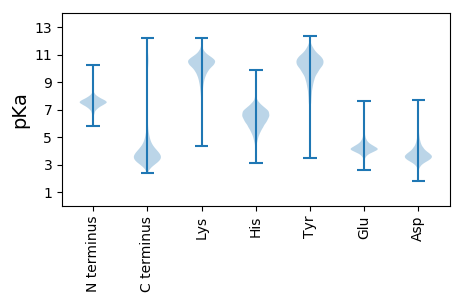
MM1 pKa = 7.58AFAFAGAAFGLAAGAAFFTAAEE23 pKa = 4.4DD24 pKa = 3.56FAAAAFAGAAFFAAGFAAAFAAGFLAGAAFFAGAALALAGAAFALAGAAFFTAGFAAALAAGFFAGAAFALGAAAFALAAGAAFFTAVAAFAAAAFTGAFFAGALDD130 pKa = 4.37AGALDD135 pKa = 4.03DD136 pKa = 5.68CLAISCPFRR145 pKa = 11.84CADD148 pKa = 3.08GRR150 pKa = 11.84YY151 pKa = 9.46
MM1 pKa = 7.58AFAFAGAAFGLAAGAAFFTAAEE23 pKa = 4.4DD24 pKa = 3.56FAAAAFAGAAFFAAGFAAAFAAGFLAGAAFFAGAALALAGAAFALAGAAFFTAGFAAALAAGFFAGAAFALGAAAFALAAGAAFFTAVAAFAAAAFTGAFFAGALDD130 pKa = 4.37AGALDD135 pKa = 4.03DD136 pKa = 5.68CLAISCPFRR145 pKa = 11.84CADD148 pKa = 3.08GRR150 pKa = 11.84YY151 pKa = 9.46
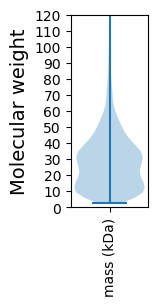
Molecular weight: 14.08 kDa
Isoelectric point according different methods:
Protein with the highest isoelectric point:
>tr|V7FQ89|V7FQ89_9RHIZ Metallophosphatase OS=Mesorhizobium sp. LSHC420B00 OX=1287292 GN=X759_00065 PE=4 SV=1
MM1 pKa = 7.35KK2 pKa = 9.43RR3 pKa = 11.84TYY5 pKa = 10.27QPSKK9 pKa = 9.73LVRR12 pKa = 11.84KK13 pKa = 9.15RR14 pKa = 11.84RR15 pKa = 11.84HH16 pKa = 4.42GFRR19 pKa = 11.84ARR21 pKa = 11.84MATKK25 pKa = 10.11GGRR28 pKa = 11.84GVVAARR34 pKa = 11.84RR35 pKa = 11.84NRR37 pKa = 11.84GRR39 pKa = 11.84KK40 pKa = 9.03RR41 pKa = 11.84LSAA44 pKa = 4.03
MM1 pKa = 7.35KK2 pKa = 9.43RR3 pKa = 11.84TYY5 pKa = 10.27QPSKK9 pKa = 9.73LVRR12 pKa = 11.84KK13 pKa = 9.15RR14 pKa = 11.84RR15 pKa = 11.84HH16 pKa = 4.42GFRR19 pKa = 11.84ARR21 pKa = 11.84MATKK25 pKa = 10.11GGRR28 pKa = 11.84GVVAARR34 pKa = 11.84RR35 pKa = 11.84NRR37 pKa = 11.84GRR39 pKa = 11.84KK40 pKa = 9.03RR41 pKa = 11.84LSAA44 pKa = 4.03
Molecular weight: 5.12 kDa
Isoelectric point according different methods:
Peptides (in silico digests for buttom-up proteomics)
Below you can find in silico digests of the whole proteome with Trypsin, Chymotrypsin, Trypsin+LysC, LysN, ArgC proteases suitable for different mass spec machines.| Try ESI |
 |
|---|
| ChTry ESI |
|
|---|
| ArgC ESI |
|
|---|
| LysN ESI |
|
|---|
| TryLysC ESI |
|
|---|
| Try MALDI |
|
|---|
| ChTry MALDI |
|
|---|
| ArgC MALDI |
|
|---|
| LysN MALDI |
|
|---|
| TryLysC MALDI |
|
|---|
| Try LTQ |
|
|---|
| ChTry LTQ |
|
|---|
| ArgC LTQ |
|
|---|
| LysN LTQ |
|
|---|
| TryLysC LTQ |
|
|---|
| Try MSlow |
|
|---|
| ChTry MSlow |
|
|---|
| ArgC MSlow |
|
|---|
| LysN MSlow |
|
|---|
| TryLysC MSlow |
|
|---|
| Try MShigh |
|
|---|
| ChTry MShigh |
|
|---|
| ArgC MShigh |
|
|---|
| LysN MShigh |
|
|---|
| TryLysC MShigh |
|
|---|
General Statistics
Number of major isoforms |
Number of additional isoforms |
Number of all proteins |
Number of amino acids |
Min. Seq. Length |
Max. Seq. Length |
Avg. Seq. Length |
Avg. Mol. Weight |
|---|---|---|---|---|---|---|---|
0 |
1930628 |
23 |
2856 |
274.8 |
29.86 |
Amino acid frequency
Ala |
Cys |
Asp |
Glu |
Phe |
Gly |
His |
Ile |
Lys |
Leu |
|---|---|---|---|---|---|---|---|---|---|
12.372 ± 0.046 | 0.843 ± 0.009 |
5.655 ± 0.026 | 5.57 ± 0.025 |
3.904 ± 0.021 | 8.467 ± 0.026 |
2.056 ± 0.016 | 5.451 ± 0.022 |
3.668 ± 0.027 | 9.949 ± 0.043 |
Met |
Asn |
Gln |
Pro |
Arg |
Ser |
Thr |
Val |
Trp |
Tyr |
|---|---|---|---|---|---|---|---|---|---|
2.535 ± 0.015 | 2.667 ± 0.016 |
5.046 ± 0.02 | 3.051 ± 0.014 |
6.965 ± 0.036 | 5.603 ± 0.019 |
5.139 ± 0.019 | 7.427 ± 0.026 |
1.377 ± 0.015 | 2.247 ± 0.016 |
Most of the basic statistics you can see at this page can be downloaded from this CSV file
See this proteome in:

Proteome-pI is available under Creative Commons Attribution-NoDerivs license, for more details see here
| Reference: Kozlowski LP. Proteome-pI 2.0: Proteome Isoelectric Point Database Update. Nucleic Acids Res. 2021, doi: 10.1093/nar/gkab944 | Contact: Lukasz P. Kozlowski |