Anaerobacillus alkalilacustris
Taxonomy: cellular organisms; Bacteria; Terrabacteria group; Firmicutes; Bacilli; Bacillales; Bacillaceae; Anaerobacillus
Average proteome isoelectric point is 6.44
Get precalculated fractions of proteins
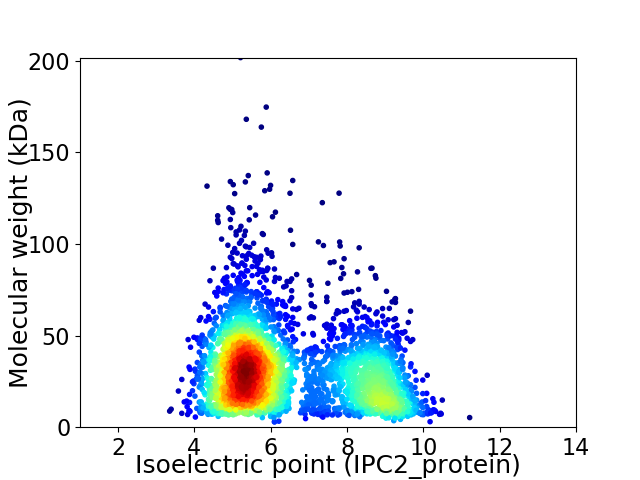
Virtual 2D-PAGE plot for 3502 proteins (isoelectric point calculated using IPC2_protein)
Get csv file with sequences according to given criteria:
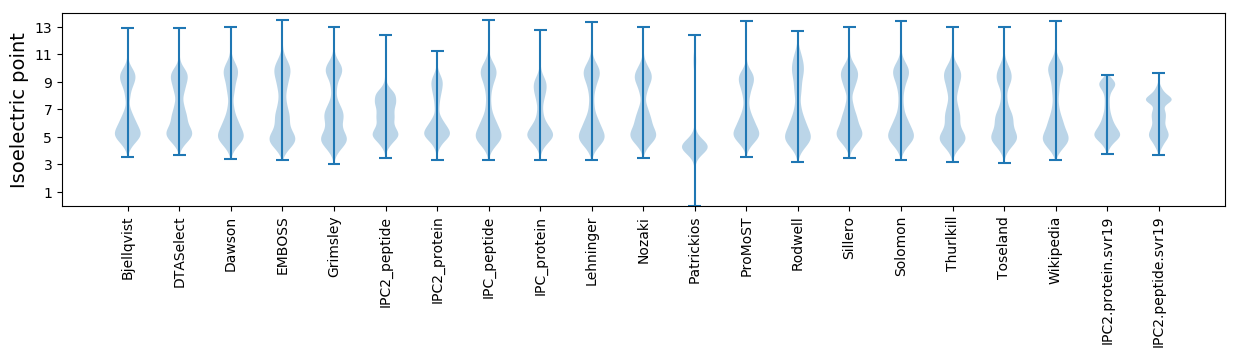
* You can choose from 21 different methods for calculating isoelectric point
Summary statistics related to proteome-wise predictions
Protein with the lowest isoelectric point:
>tr|A0A1S2LJI9|A0A1S2LJI9_9BACI Uncharacterized protein OS=Anaerobacillus alkalilacustris OX=393763 GN=BKP37_12935 PE=4 SV=1
MM1 pKa = 7.63IDD3 pKa = 3.62KK4 pKa = 10.9NYY6 pKa = 10.01GAYY9 pKa = 10.51VLICDD14 pKa = 3.54ICGNEE19 pKa = 4.08ADD21 pKa = 4.14QSFDD25 pKa = 3.41TFDD28 pKa = 3.46NAIDD32 pKa = 3.94AKK34 pKa = 11.32NEE36 pKa = 4.05LGWRR40 pKa = 11.84SEE42 pKa = 4.01RR43 pKa = 11.84GEE45 pKa = 3.98QLDD48 pKa = 5.51LKK50 pKa = 10.85DD51 pKa = 4.03GWVDD55 pKa = 4.63LCPDD59 pKa = 3.75CQQ61 pKa = 3.53
MM1 pKa = 7.63IDD3 pKa = 3.62KK4 pKa = 10.9NYY6 pKa = 10.01GAYY9 pKa = 10.51VLICDD14 pKa = 3.54ICGNEE19 pKa = 4.08ADD21 pKa = 4.14QSFDD25 pKa = 3.41TFDD28 pKa = 3.46NAIDD32 pKa = 3.94AKK34 pKa = 11.32NEE36 pKa = 4.05LGWRR40 pKa = 11.84SEE42 pKa = 4.01RR43 pKa = 11.84GEE45 pKa = 3.98QLDD48 pKa = 5.51LKK50 pKa = 10.85DD51 pKa = 4.03GWVDD55 pKa = 4.63LCPDD59 pKa = 3.75CQQ61 pKa = 3.53
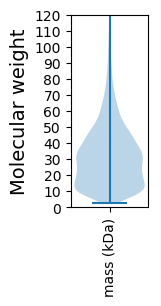
Molecular weight: 6.92 kDa
Isoelectric point according different methods:
Protein with the highest isoelectric point:
>tr|A0A1S2LXP0|A0A1S2LXP0_9BACI Amidohydrolase OS=Anaerobacillus alkalilacustris OX=393763 GN=BKP37_01890 PE=4 SV=1
MM1 pKa = 7.71GKK3 pKa = 8.0PTFQPNNRR11 pKa = 11.84KK12 pKa = 9.23RR13 pKa = 11.84KK14 pKa = 8.22KK15 pKa = 8.69VHH17 pKa = 5.46GFRR20 pKa = 11.84ARR22 pKa = 11.84MSTANGRR29 pKa = 11.84KK30 pKa = 8.48VLARR34 pKa = 11.84RR35 pKa = 11.84RR36 pKa = 11.84RR37 pKa = 11.84KK38 pKa = 9.05GRR40 pKa = 11.84KK41 pKa = 8.7VLSAA45 pKa = 4.05
MM1 pKa = 7.71GKK3 pKa = 8.0PTFQPNNRR11 pKa = 11.84KK12 pKa = 9.23RR13 pKa = 11.84KK14 pKa = 8.22KK15 pKa = 8.69VHH17 pKa = 5.46GFRR20 pKa = 11.84ARR22 pKa = 11.84MSTANGRR29 pKa = 11.84KK30 pKa = 8.48VLARR34 pKa = 11.84RR35 pKa = 11.84RR36 pKa = 11.84RR37 pKa = 11.84KK38 pKa = 9.05GRR40 pKa = 11.84KK41 pKa = 8.7VLSAA45 pKa = 4.05
Molecular weight: 5.25 kDa
Isoelectric point according different methods:
Peptides (in silico digests for buttom-up proteomics)
Below you can find in silico digests of the whole proteome with Trypsin, Chymotrypsin, Trypsin+LysC, LysN, ArgC proteases suitable for different mass spec machines.| Try ESI |
 |
|---|
| ChTry ESI |
|
|---|
| ArgC ESI |
|
|---|
| LysN ESI |
|
|---|
| TryLysC ESI |
|
|---|
| Try MALDI |
|
|---|
| ChTry MALDI |
|
|---|
| ArgC MALDI |
|
|---|
| LysN MALDI |
|
|---|
| TryLysC MALDI |
|
|---|
| Try LTQ |
|
|---|
| ChTry LTQ |
|
|---|
| ArgC LTQ |
|
|---|
| LysN LTQ |
|
|---|
| TryLysC LTQ |
|
|---|
| Try MSlow |
|
|---|
| ChTry MSlow |
|
|---|
| ArgC MSlow |
|
|---|
| LysN MSlow |
|
|---|
| TryLysC MSlow |
|
|---|
| Try MShigh |
|
|---|
| ChTry MShigh |
|
|---|
| ArgC MShigh |
|
|---|
| LysN MShigh |
|
|---|
| TryLysC MShigh |
|
|---|
General Statistics
Number of major isoforms |
Number of additional isoforms |
Number of all proteins |
Number of amino acids |
Min. Seq. Length |
Max. Seq. Length |
Avg. Seq. Length |
Avg. Mol. Weight |
|---|---|---|---|---|---|---|---|
0 |
1032631 |
26 |
1767 |
294.9 |
33.28 |
Amino acid frequency
Ala |
Cys |
Asp |
Glu |
Phe |
Gly |
His |
Ile |
Lys |
Leu |
|---|---|---|---|---|---|---|---|---|---|
6.207 ± 0.039 | 0.819 ± 0.014 |
4.987 ± 0.032 | 7.638 ± 0.046 |
4.675 ± 0.029 | 6.54 ± 0.035 |
2.046 ± 0.021 | 8.473 ± 0.045 |
7.274 ± 0.039 | 9.78 ± 0.044 |
Met |
Asn |
Gln |
Pro |
Arg |
Ser |
Thr |
Val |
Trp |
Tyr |
|---|---|---|---|---|---|---|---|---|---|
2.602 ± 0.017 | 4.894 ± 0.026 |
3.433 ± 0.025 | 3.64 ± 0.023 |
3.986 ± 0.032 | 5.954 ± 0.031 |
5.385 ± 0.029 | 7.131 ± 0.034 |
0.97 ± 0.015 | 3.565 ± 0.026 |
Most of the basic statistics you can see at this page can be downloaded from this CSV file
See this proteome in:

Proteome-pI is available under Creative Commons Attribution-NoDerivs license, for more details see here
| Reference: Kozlowski LP. Proteome-pI 2.0: Proteome Isoelectric Point Database Update. Nucleic Acids Res. 2021, doi: 10.1093/nar/gkab944 | Contact: Lukasz P. Kozlowski |