Azonexus hydrophilus
Taxonomy: cellular organisms; Bacteria; Proteobacteria; Betaproteobacteria; Rhodocyclales; Azonexaceae; Azonexus
Average proteome isoelectric point is 6.49
Get precalculated fractions of proteins
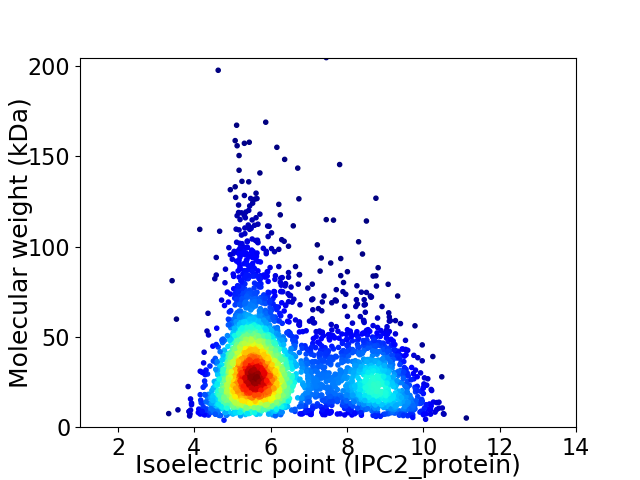
Virtual 2D-PAGE plot for 3392 proteins (isoelectric point calculated using IPC2_protein)
Get csv file with sequences according to given criteria:
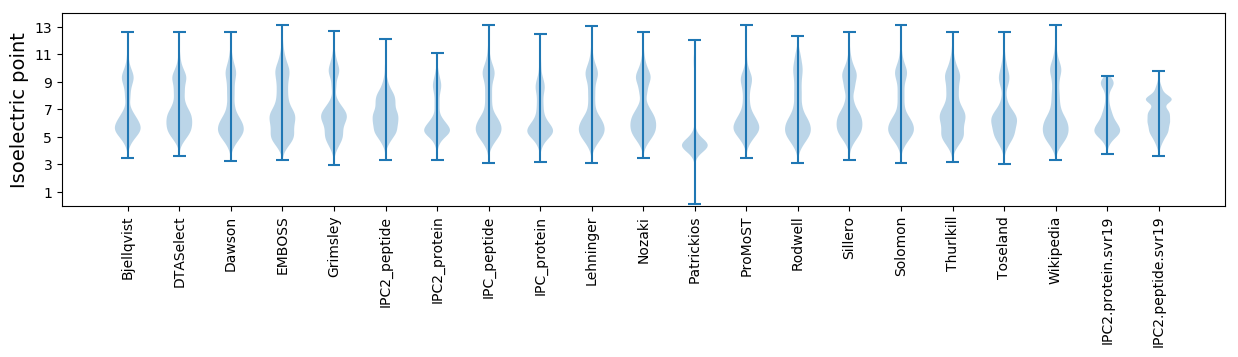
* You can choose from 21 different methods for calculating isoelectric point
Summary statistics related to proteome-wise predictions
Protein with the lowest isoelectric point:
>tr|A0A1R1I835|A0A1R1I835_9RHOO Pyridoxine 5'-phosphate synthase OS=Azonexus hydrophilus OX=418702 GN=pdxJ PE=3 SV=1
MM1 pKa = 7.72PKK3 pKa = 10.19YY4 pKa = 9.67PEE6 pKa = 4.5CWQSCGSCASGDD18 pKa = 3.79VFILEE23 pKa = 4.41VLVQPGDD30 pKa = 3.6VLNFDD35 pKa = 5.39DD36 pKa = 6.51NILTLEE42 pKa = 4.15TGKK45 pKa = 10.49VALDD49 pKa = 4.02IPSPWAGRR57 pKa = 11.84VVEE60 pKa = 4.0IHH62 pKa = 5.3VTAGDD67 pKa = 3.79NVAEE71 pKa = 4.37GAPLITLEE79 pKa = 4.55CDD81 pKa = 2.91
MM1 pKa = 7.72PKK3 pKa = 10.19YY4 pKa = 9.67PEE6 pKa = 4.5CWQSCGSCASGDD18 pKa = 3.79VFILEE23 pKa = 4.41VLVQPGDD30 pKa = 3.6VLNFDD35 pKa = 5.39DD36 pKa = 6.51NILTLEE42 pKa = 4.15TGKK45 pKa = 10.49VALDD49 pKa = 4.02IPSPWAGRR57 pKa = 11.84VVEE60 pKa = 4.0IHH62 pKa = 5.3VTAGDD67 pKa = 3.79NVAEE71 pKa = 4.37GAPLITLEE79 pKa = 4.55CDD81 pKa = 2.91
Molecular weight: 8.64 kDa
Isoelectric point according different methods:
Protein with the highest isoelectric point:
>tr|A0A1R1IBQ5|A0A1R1IBQ5_9RHOO Uncharacterized protein OS=Azonexus hydrophilus OX=418702 GN=BJN45_00280 PE=4 SV=1
MM1 pKa = 7.35KK2 pKa = 9.36RR3 pKa = 11.84TYY5 pKa = 9.97QPSVVRR11 pKa = 11.84RR12 pKa = 11.84KK13 pKa = 8.6RR14 pKa = 11.84THH16 pKa = 5.71GFLVRR21 pKa = 11.84SRR23 pKa = 11.84TKK25 pKa = 10.32GGRR28 pKa = 11.84AVLAARR34 pKa = 11.84RR35 pKa = 11.84AKK37 pKa = 9.87GRR39 pKa = 11.84KK40 pKa = 8.75RR41 pKa = 11.84LAVV44 pKa = 3.41
MM1 pKa = 7.35KK2 pKa = 9.36RR3 pKa = 11.84TYY5 pKa = 9.97QPSVVRR11 pKa = 11.84RR12 pKa = 11.84KK13 pKa = 8.6RR14 pKa = 11.84THH16 pKa = 5.71GFLVRR21 pKa = 11.84SRR23 pKa = 11.84TKK25 pKa = 10.32GGRR28 pKa = 11.84AVLAARR34 pKa = 11.84RR35 pKa = 11.84AKK37 pKa = 9.87GRR39 pKa = 11.84KK40 pKa = 8.75RR41 pKa = 11.84LAVV44 pKa = 3.41
Molecular weight: 5.08 kDa
Isoelectric point according different methods:
Peptides (in silico digests for buttom-up proteomics)
Below you can find in silico digests of the whole proteome with Trypsin, Chymotrypsin, Trypsin+LysC, LysN, ArgC proteases suitable for different mass spec machines.| Try ESI |
 |
|---|
| ChTry ESI |
|
|---|
| ArgC ESI |
|
|---|
| LysN ESI |
|
|---|
| TryLysC ESI |
|
|---|
| Try MALDI |
|
|---|
| ChTry MALDI |
|
|---|
| ArgC MALDI |
|
|---|
| LysN MALDI |
|
|---|
| TryLysC MALDI |
|
|---|
| Try LTQ |
|
|---|
| ChTry LTQ |
|
|---|
| ArgC LTQ |
|
|---|
| LysN LTQ |
|
|---|
| TryLysC LTQ |
|
|---|
| Try MSlow |
|
|---|
| ChTry MSlow |
|
|---|
| ArgC MSlow |
|
|---|
| LysN MSlow |
|
|---|
| TryLysC MSlow |
|
|---|
| Try MShigh |
|
|---|
| ChTry MShigh |
|
|---|
| ArgC MShigh |
|
|---|
| LysN MShigh |
|
|---|
| TryLysC MShigh |
|
|---|
General Statistics
Number of major isoforms |
Number of additional isoforms |
Number of all proteins |
Number of amino acids |
Min. Seq. Length |
Max. Seq. Length |
Avg. Seq. Length |
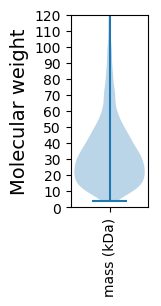
Avg. Mol. Weight |
|---|---|---|---|---|---|---|---|
0 |
1107130 |
33 |
1888 |
326.4 |
35.7 |
Amino acid frequency
Ala |
Cys |
Asp |
Glu |
Phe |
Gly |
His |
Ile |
Lys |
Leu |
|---|---|---|---|---|---|---|---|---|---|
11.833 ± 0.054 | 1.04 ± 0.015 |
5.483 ± 0.028 | 5.949 ± 0.039 |
3.777 ± 0.026 | 8.053 ± 0.039 |
2.244 ± 0.021 | 5.265 ± 0.029 |
3.665 ± 0.034 | 11.111 ± 0.059 |
Met |
Asn |
Gln |
Pro |
Arg |
Ser |
Thr |
Val |
Trp |
Tyr |
|---|---|---|---|---|---|---|---|---|---|
2.44 ± 0.019 | 2.932 ± 0.025 |
4.805 ± 0.027 | 3.772 ± 0.026 |
6.754 ± 0.04 | 5.273 ± 0.026 |
4.823 ± 0.028 | 7.131 ± 0.039 |
1.361 ± 0.02 | 2.287 ± 0.02 |
Most of the basic statistics you can see at this page can be downloaded from this CSV file
See this proteome in:

Proteome-pI is available under Creative Commons Attribution-NoDerivs license, for more details see here
| Reference: Kozlowski LP. Proteome-pI 2.0: Proteome Isoelectric Point Database Update. Nucleic Acids Res. 2021, doi: 10.1093/nar/gkab944 | Contact: Lukasz P. Kozlowski |