Klebsiella phage ST846-OXA48phi9.1
Taxonomy: Viruses; Duplodnaviria; Heunggongvirae; Uroviricota; Caudoviricetes; Caudovirales; Siphoviridae; unclassified Siphoviridae
Average proteome isoelectric point is 6.68
Get precalculated fractions of proteins
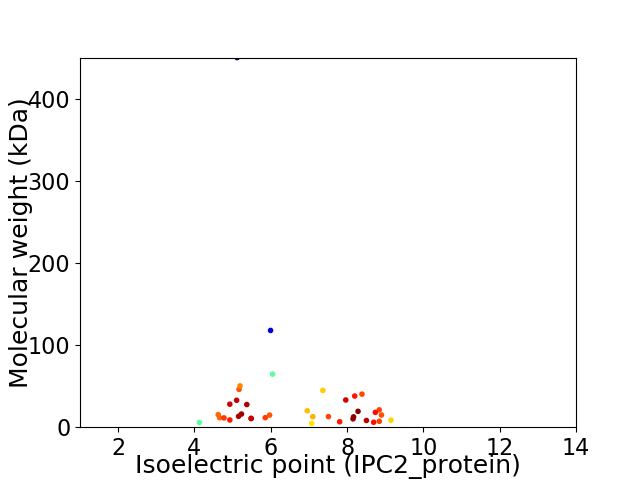
Virtual 2D-PAGE plot for 38 proteins (isoelectric point calculated using IPC2_protein)
Get csv file with sequences according to given criteria:
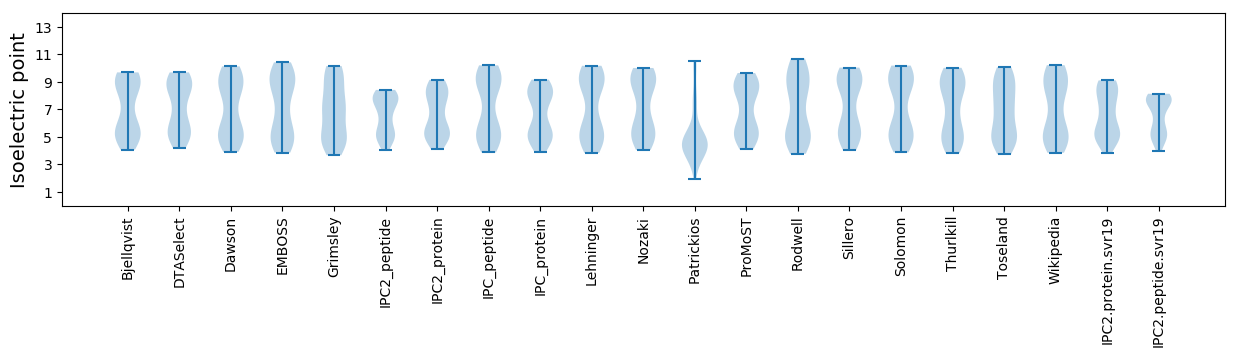
* You can choose from 21 different methods for calculating isoelectric point
Summary statistics related to proteome-wise predictions
Protein with the lowest isoelectric point:
>tr|A0A482IM14|A0A482IM14_9CAUD Uncharacterized protein OS=Klebsiella phage ST846-OXA48phi9.1 OX=2510488 PE=4 SV=1
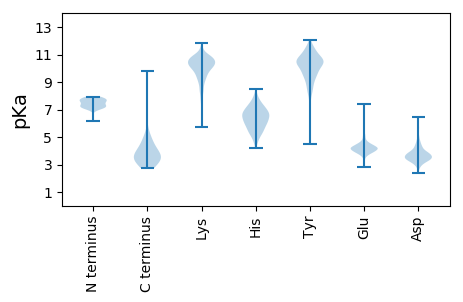
MM1 pKa = 7.61KK2 pKa = 9.8NLKK5 pKa = 9.17IAYY8 pKa = 9.39VDD10 pKa = 3.56EE11 pKa = 4.49KK12 pKa = 11.1LVAIEE17 pKa = 5.21CDD19 pKa = 3.58GLSCSSLPFSEE30 pKa = 5.39FPIDD34 pKa = 3.79STALTLPQLMLEE46 pKa = 4.46DD47 pKa = 4.88AYY49 pKa = 10.95AATSS53 pKa = 3.27
MM1 pKa = 7.61KK2 pKa = 9.8NLKK5 pKa = 9.17IAYY8 pKa = 9.39VDD10 pKa = 3.56EE11 pKa = 4.49KK12 pKa = 11.1LVAIEE17 pKa = 5.21CDD19 pKa = 3.58GLSCSSLPFSEE30 pKa = 5.39FPIDD34 pKa = 3.79STALTLPQLMLEE46 pKa = 4.46DD47 pKa = 4.88AYY49 pKa = 10.95AATSS53 pKa = 3.27
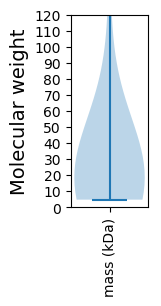
Molecular weight: 5.75 kDa
Isoelectric point according different methods:
Protein with the highest isoelectric point:
>tr|A0A482IJM0|A0A482IJM0_9CAUD Portal protein OS=Klebsiella phage ST846-OXA48phi9.1 OX=2510488 PE=4 SV=1
MM1 pKa = 7.28YY2 pKa = 10.75RR3 pKa = 11.84MDD5 pKa = 4.69KK6 pKa = 9.8LTTGIAYY13 pKa = 7.53GTSAGNAGFWMLQLLDD29 pKa = 4.46KK30 pKa = 11.03VSPSQWAAIGVLGSLVFGLLTYY52 pKa = 8.49LTNVYY57 pKa = 10.08FKK59 pKa = 10.82IKK61 pKa = 10.04DD62 pKa = 3.68DD63 pKa = 3.41RR64 pKa = 11.84RR65 pKa = 11.84KK66 pKa = 10.01AARR69 pKa = 11.84SGDD72 pKa = 3.58GKK74 pKa = 10.74QSEE77 pKa = 4.7TT78 pKa = 3.84
MM1 pKa = 7.28YY2 pKa = 10.75RR3 pKa = 11.84MDD5 pKa = 4.69KK6 pKa = 9.8LTTGIAYY13 pKa = 7.53GTSAGNAGFWMLQLLDD29 pKa = 4.46KK30 pKa = 11.03VSPSQWAAIGVLGSLVFGLLTYY52 pKa = 8.49LTNVYY57 pKa = 10.08FKK59 pKa = 10.82IKK61 pKa = 10.04DD62 pKa = 3.68DD63 pKa = 3.41RR64 pKa = 11.84RR65 pKa = 11.84KK66 pKa = 10.01AARR69 pKa = 11.84SGDD72 pKa = 3.58GKK74 pKa = 10.74QSEE77 pKa = 4.7TT78 pKa = 3.84
Molecular weight: 8.58 kDa
Isoelectric point according different methods:
Peptides (in silico digests for buttom-up proteomics)
Below you can find in silico digests of the whole proteome with Trypsin, Chymotrypsin, Trypsin+LysC, LysN, ArgC proteases suitable for different mass spec machines.| Try ESI |
 |
|---|
| ChTry ESI |
|
|---|
| ArgC ESI |
|
|---|
| LysN ESI |
|
|---|
| TryLysC ESI |
|
|---|
| Try MALDI |
|
|---|
| ChTry MALDI |
|
|---|
| ArgC MALDI |
|
|---|
| LysN MALDI |
|
|---|
| TryLysC MALDI |
|
|---|
| Try LTQ |
|
|---|
| ChTry LTQ |
|
|---|
| ArgC LTQ |
|
|---|
| LysN LTQ |
|
|---|
| TryLysC LTQ |
|
|---|
| Try MSlow |
|
|---|
| ChTry MSlow |
|
|---|
| ArgC MSlow |
|
|---|
| LysN MSlow |
|
|---|
| TryLysC MSlow |
|
|---|
| Try MShigh |
|
|---|
| ChTry MShigh |
|
|---|
| ArgC MShigh |
|
|---|
| LysN MShigh |
|
|---|
| TryLysC MShigh |
|
|---|
General Statistics
Number of major isoforms |
Number of additional isoforms |
Number of all proteins |
Number of amino acids |
Min. Seq. Length |
Max. Seq. Length |
Avg. Seq. Length |
Avg. Mol. Weight |
|---|---|---|---|---|---|---|---|
0 |
11819 |
44 |
4234 |
311.0 |
33.88 |
Amino acid frequency
Ala |
Cys |
Asp |
Glu |
Phe |
Gly |
His |
Ile |
Lys |
Leu |
|---|---|---|---|---|---|---|---|---|---|
10.356 ± 0.792 | 0.888 ± 0.3 |
5.753 ± 0.228 | 5.212 ± 0.585 |
2.953 ± 0.312 | 7.759 ± 0.357 |
1.227 ± 0.362 | 5.576 ± 0.583 |
5.203 ± 0.522 | 8.571 ± 0.606 |
Met |
Asn |
Gln |
Pro |
Arg |
Ser |
Thr |
Val |
Trp |
Tyr |
|---|---|---|---|---|---|---|---|---|---|
2.335 ± 0.427 | 4.823 ± 0.652 |
3.52 ± 0.437 | 5.077 ± 0.361 |
5.11 ± 0.323 | 7.429 ± 0.665 |
7.666 ± 1.292 | 6.405 ± 0.384 |
1.447 ± 0.179 | 2.691 ± 0.215 |
Most of the basic statistics you can see at this page can be downloaded from this CSV file
See this proteome in:

Proteome-pI is available under Creative Commons Attribution-NoDerivs license, for more details see here
| Reference: Kozlowski LP. Proteome-pI 2.0: Proteome Isoelectric Point Database Update. Nucleic Acids Res. 2021, doi: 10.1093/nar/gkab944 | Contact: Lukasz P. Kozlowski |